Posted by OromianEconomist in Uncategorized.
Tags: Africa, African Studies, Ethiopia and social progress index, Global Competitiveness Report, Global creative Index 2015, Talent and Tolerance, Tech

What that makes a country creative? A new research shows that it’s talent, technology, and tolerance: (3T’s).
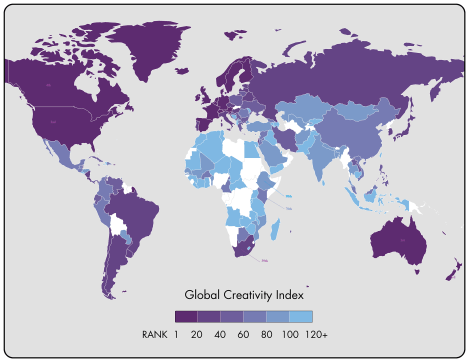
The Martin Prosperity Institute (MPI), housed at the University of Toronto, published the 2015 edition of its ‘Global Creativity Index’ (GCI). The GCI is a broad-based measure for advanced economic growth and sustainable prosperity based on the three T’s of economic development: - talent, technology, and tolerance. It aimed at rating and ranking 196 countries worldwide on each of these dimensions and on an overall measure of creativity and prosperity.
Technology rankings were based on investment levels in research and development, plus how many patent applications per capita each country had.
Talent was evaluated by using a composite of the percentage of adults who owned an advanced degree, as well as the percentage of the workforce that had jobs in the creative industry.
Rankings for the third factor, tolerance, were found based on how each country treated their immigrants, the diversity of the racial and ethnic minorities, and how many LGBT residents were in each country.
To obtain their rankings, the researchers analyzed 139 countries, with many countries of low economic status being left off the list as complete data couldn’t be sourced, and ranked them in each category. Overall creativity was determined by each country’s ranking across the T’s, then divided by the total observations made in each category patent applications per capita, creative-class measure, etc.
Australia was found to be the most creative on the GCI, supplanting Sweden, which took top spot in the previous 2004 and 2011 editions, with a global ranking of 1 in talent, 4 in tolerance, and 7 in technology.
As Australia has taken the number one spot on the index with a score of 0.97 out of one, the US has been second and New Zealand third.
Luxembourg has the largest share of the creative class (54%), which spans science and technology; arts and culture; and business, management, and the professions.
South Korea leads in technology. Japan is second, Israel third, the United States fourth, and Finland is fifth. Australia, New Zealand, Germany, Singapore and Denmark round out the top ten. Australia leads in talent. Iceland is second. The United States and Finland are tied for third with Singapore in fifth. Denmark, Slovenia, Belarus, New Zealand, and Sweden round out the top ten.
Canada takes the top spot in tolerance which is measured as openness to ethnic and other minorities . Iceland is second, New Zealand third, Australia fourth, and the United Kingdom fifth. The Netherlands, Uruguay, Ireland, Norway, and Sweden round out the top ten.
Among African countries, only South Africa (39) making among the top 50. Mauritius is in 59th and Kenya is ranked 70th.
27 of 50 lowest scoring countries are from Africa.
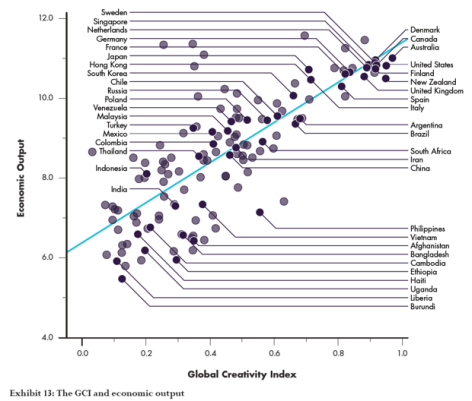
According to the report: “The GCI is closely associated with key measures of economic and social progress. Nations that score highly on the GCI have higher levels of economic output, entrepreneurship, economic competitiveness, and overall human development… .Creativity is also closely associated with urbanization, with more urbanized nations scoring higher on the GCI.”
Global creativity, as measured by the GCI, is closely connected to key measures economic development and social progress, competitiveness, and prosperity of countries.The GCI is associated with higher levels of equality. The researchers also claimed to have found a link between social equality and creativity, especially in the countries that ranked high on the GCI. “While some countries, like the United States and the United Kingdom, achieve high GCI scores alongside relatively high levels of inequality, generally speaking, higher levels of global creativity are associated with lower levels of inequality.”
http://www.medicaldaily.com/global-creativity-index-measures-tech-talent-and-tolerance-these-are-most-creative-357534
Click to access Global-Creativity-Index-2015.pdf
Posted by OromianEconomist in Uncategorized.
Tags: Africa, economics, Global Competitiveness Report, What are the 10 most competitive economies in sub-Saharan Africa?, World Economic Forum
What are the 10 most competitive economies in sub-Saharan Africa?
By Caroline Galvan, World Economic Forum, Sep 30 2015
https://agenda.weforum.org/2015/09/what-are-the-10-most-competitive-economies-in-sub-saharan-africa/?utm_content=buffercdfaa&utm_medium=social&utm_source=twitter.com&utm_campaign=buffer
Despite growth averaging more than 5% a year since the turn of the century, sub-Saharan Africa’s economies remain largely noncompetitive: only three of the region’s countries – Mauritius (46th), South Africa (49th) and Rwanda (58th) three – rank in the top half of the 2015-2016 edition of the Global Competitiveness Index, and they occupy 15 of the bottom 20 places.
In general, the region has made progress in efficiency-enhancing market reform, especially in goods market, but has much more to do to improve its institutions, infrastructure, and health and education sectors, all areas in which reforms will take time to reap benefits. With a coming youth bulge – by 2035, more people will be reaching working age in sub-Saharan Africa than in the rest of the world put together – the need to improve education systems is especially urgent.
The recent fall in commodity prices, putting more pressure on many countries in the region, has also accentuated the need to prioritize competitiveness-enhancing reforms.
Mauritius. Although still the top-ranked country in sub-Saharan Africa, Mauritius dropped seven places to 46th (out of 140) in the overall rankings this year – the first fall down the Index after a decade of improvements. This is accounted for important drops in three of the 12 pillars (overall six pillars are losing places) on which the Index is based, labour market efficiency, financial market development and market size. Still, some fundamentals remain strong: Mauritius has the region’s most efficient goods market, best infrastructure and most healthy and educated workforce. To move further up the development ladder it particularly needs to improve the quality of higher education, the rate at which it adopts new technologies and its capacity to nurture innovation.

South Africa. Moving in the opposite direction to Mauritius, South Africa climbs seven places to 49th. It has improved year-on-year in its uptake of ICTs and established itself as the region’s most innovative economy. South Africa also tops the region for the efficiency of its financial markets, a pillar on which it ranks 12thglobally. It performs reasonably strongly on the pillars of infrastructure and institutions, although corruption and security remain concerns, but needs to make progress on health and education.
Rwanda. Advancing four places for the second year in a row, Rwanda’s overall position of 58th reflects improvements in the financial development pillar – especially regulation of securities exchanges – and business sophistication. It scores 8thglobally for labour market efficiency, thanks in part to the third-highest female labour participation rate in the world, and 17th globally for the strength of its public and private institutions. However, improvements are needed in some fundamental areas of competitiveness including infrastructure, health and higher education.
Botswana. Up three places to 71st, Botswana posts a top-10 score globally for the stability of its macroeconomic environment. It also boasts relatively strong rankings on institutions and labour market efficiency. Despite some improvements in the last year, however, the health and primary education pillar remains its weakest, with the impact of HIV/AIDS and tuberculosis contributing to the second-lowest life expectancy among the 140 economies surveyed.
Namibia. Advancing for the third year in a row, Namibia gains three places to rank 85th in the global Index. It registered year-on-year improvements in nine of the 12 pillars, most notably business sophistication and innovation – albeit from a low base. It improved its score on its strongest pillar, institutions, but slipped back on its weakest, health and primary education; as in Botswana, tuberculosis and HIV/AIDS remain among the biggest concerns.
Cote d’Ivoire. Leaping 24 places in the last year alone to reach 91st in the overall Index, Cote d’Ivoire has now progressed 40 places in the last three years. It has improved year-on-year on every pillar except for the macroeconomic environment, posting its biggest gains in areas such as innovation, financial market development and institutions – all pillars on which it scores in the top half globally. Despite progress also in health and primary education and higher education and training, they remain its weakest area.
Zambia. Although occupying the same position in the Index as last year, 96th, Zambia has noticeably progressed on some pillars while regressing on others. It has improved its score on macroeconomic stability, for example, with progress on the government budget balance – albeit from a low base – and public debt. However, it drops heavily on the pillars of business sophistication, goods market efficiency and financial market development.
Seychelles. Despite being considerably wealthier than the seven countries in the region that rank as more competitive, the Seychelles loses ground for the third year in a row, dropping five places to 97th overall. The country’s competitiveness is held back by a small market size, scoring bottom globally on this pillar. However, it still ranks in the top half globally on seven of the 12 pillars, with its strongest performances coming on infrastructure (2nd best in the region) and labour market efficiency. It also does well on technological readiness (71st, although low performing second in regional comparison).
Kenya. After two years of forward movement in the Index, Kenya slips nine places to 99th with regressions on three pillars in particular: goods market efficiency, financial market development and institutions. Corruption remains the top concern about doing business in the country, according to executives who took part in a survey which forms part of the Index calculations. Despite the decline, financial market development remains one of Kenya’s three strongest pillars, along with innovation and labour market efficiency; its weakest are the macroeconomic environment and, despite a small improvement in the last year, health and primary education.
Gabon. Improving slightly to 103rd overall, Gabon’s main strength is its macroeconomic environment, which is rated among the world’s top 20 thanks to a positive budget balance and low levels of government debt, reflective of its resource-driven economy. However, this is the only pillar on which Gabon ranks in the top half globally, and it ranks among the world’s bottom 20 on four pillars: goods market efficiency, higher education and training, business sophistication and innovation. To diversify its economy, it needs to invest in productivity-enhancing reforms across the board.
https://agenda.weforum.org/2015/09/what-are-the-10-most-competitive-economies-in-sub-saharan-africa/?utm_content=buffercdfaa&utm_medium=social&utm_source=twitter.com&utm_campaign=buffer
The Global Competitiveness Report 2015-2016 is available here.
Posted by OromianEconomist in Africa, Africa Rising.
Tags: Africa, Africa is not rising, Africa Rising, Global Competitiveness Report, The development of Africa's Underdevelopment, The Looting Machine, Youth Unemployment
‘African economies consistently underperform the Southeast Asian average across all the pillars. The most critical gaps continue to be seen in the areas of basic requirements of competitiveness: institutions, infrastructure, and education and skills.19 This is troubling because the majority of African economies are classified as factor-driven economies (see Table 1), so these areas are currently the most critical areas for the competitiveness of these countries. On a more positive note, Africa’s financial, goods, and labor markets function comparatively well (on par, or nearly on par, with Latin America). However, ease of entry and exit from low-wage, low-productivity jobs will not lead to improved competitiveness. It will be important to build upon the region’s comparatively efficient markets by investing in other competitiveness-enhancing reforms. A particular point of concern is the continent’s weak institutions. Although Africa’s performance is similar to that of Southeast Asia and Latin America and the Caribbean in this pillar, the institutions in all three regions receive scores below 4 out of 7. This suggests that more effort should be made to increase the capacity of the institutional framework, as it provides a critical foundation for the other dimensions of competitiveness. Indeed, the quality of institutions has actually been deteriorating in both OECD and African economies according to the GCI. This might explain in part why Africa’s competitiveness seems to have stagnated in comparison to OECD economies
(see Figure 11a). In Africa, a decline in security and government efficiency—two components of the public institutions subpillar—would appear to be at the core of this decline. Sound public institutions and governance are an important prerequisite for economic development.’- Africa_Competitiveness_Report_2015
Is Africa really rising? History and facts suggest it isn’t
In the year 2000, the Economist ran a cover story with the title “Hopeless Africa”. Four years later, Robert Guest, who served as the newspaper’s Africa Editor, published “The Shackled Continent”, a book that pretty much concluded that, absent any miracles, Africa’s future was bleak. The book was widely praised, not least of all by all-round Africa expert Bob Geldof who said “[it] was written with a passion for Africa and Africans”. Then in 2011, the current era of Afro-euphoria signalled its triumphant entrance with the Economist’s Africa Rising cover story. In contrast to their cover story of just a couple of years back, this one declared that there was hope for the hopeless continent (TIME did exactly the same thing in 2012).
We’ve written about the Africa Rising meme on this site, from culture to politics to music to fashion, again and again and again and again and again and again andagain and again. Now for the economics.
To be sure, African economies have begun growing again after contracting for most of the 1980s and 1990s. According to the World Bank, real GDP per capita shrank at a rate of 1% per year over the period 1980 to 2000 for sub-Saharan Africa as a whole. Since 2000, real GDP per capita has grown at the more respectable rate of 2% per year. And it appears that the incidence of poverty, at least as measured by the World Bank, also declined, although marginally, during the last decade.
Many so-called Africa watchers seem to have caught the “Africa rising” bug. There is now wide expectation, undergirded of course by the likes of the Economist, that growth will continue unabated going forward. Africa’s time is now! So declared a piece in the trendy Harvard Business Review.
The “Africa rising” narrative suggests the continent is now well on its way to self-sustaining growth. The kind of growth that the East Asian “tigers” and the countries known as the West experienced during the times they were rising. The kind of growth that has led to a massive reduction in poverty in China within a generation. Unfortunately here is where reality stands at odds with the euphoria.
Africa’s current growth revival (the continent did grow, and healthily so, from the 1960s to the 1970s) seems to be largely driven by external factors: China’s spectacular growth and along with it an increase in the price of commodities, whose exports Africa relies on to a great extent. So any slowdown in China’s growth, as is likely to happen as its economy matures, is likely to impact greatly on Africa’s performance.
To be sure, there have also been some internal drivers of growth: price distortions have been reduced in agriculture, macroeconomic stability has been restored (inflation rates are low and stable across most of the continent) and political institutions have improved (democracy and elections are now more common on the continent than before). But the prospects of these internal policies to sustain long-run growth are dismal. The Harvard economist Dani Rodrik, in a highly insightful essay titled “An African Growth Miracle?”, points out that the relationship between standard measures of good policies (macroeconomic stability, reduced price distortions, etc…) and economic growth tends to be weak. At best, good policies make economic crises less prevalent but cannot sustain and drive growth on their own. The same is also true of institutions, which following the much publicized work of Daron Acemoglu and friends, has become the be all and end all of development thinking. Rodrik points out that Latin America has experienced positive institutional changes within the last 20 years with a small payoff in growth. On the other hand, impressive growth in South Korea (until the 1990s) and China (today) has occurred alongside rampant cronyism and corruption.
According to Rodrik, self-sustaining growth begins to occur when an economy undergoes a structural transformation from relying less on agriculture to relying more on industry. That is, self-sustaining growth is underpinned by large-scale industrialization. This is the historical lesson of the East Asian tigers, of China, and of even the West. Unfortunately the facts for Africa point in the opposite direction. Yes, African labour has moved out of agriculture in large numbers, but the beneficiary has not been manufacturing but services. The service sector tends not to be as “productive” as the manufacturing sector. And productivity, which is the ability to produce ever more output from the same amount of inputs, is what drives and sustains growth. The share of manufacturing in the economies of most African countries has declined from about 15% in the 1970s to around 10% today. That is Africa has in fact deindustrialized! And even the 10% of GDP that is manufacturing is mostly made up of small informal firms that are not particularly productive and are unlikely to evolve into big formal firms. Rodrik sums up his prospects for Africa thus:
“To sum up, the African pattern of structural change is very different from the classic pattern that has produced high growth in Asia, and before that, the European industrializers. Labour is moving out of agriculture and rural areas. But formal manufacturing industries are not the main beneficiary. Urban migrants are being absorbed largely into services that are not particularly productive and into informal activities. The pace of industrialization is much too slow to [spurn self-sustaining growth].”
So what can be done? Rodrik suggests that industrialization can be helped along by improving the “business climate” in Africa. But the problem with the business climate argument, apart from being vague, is that it does not confront the fact that Africa was more industrialized in the 1970s, at a time when the business climate was likely no different from what it is today. In my opinion, the Structural Adjustment Policies (SAPs) that were administered beginning in the early 1980s are largely responsible for halting the pace of industrialization on the continent. With SAPs, Africans were told by their betters to stop supporting industry because doing so was “wasteful”. Subsidies to industry were reduced. Protective trade barriers were removed. Planning for industry was done away with. All this advice was dispensed in spite of the fact that today’s developed countries industrialized behind a veil of considerable state support. For instance, the historian Sven Beckert points out that Britain’s cloth manufacturing industry, which was largely responsible for the Industrial Revolution, was shielded from competition from India for most of the 18thCentury. The Cambridge economist Ha-Joon Chang has called this phenomenon of rich countries forcing policies on poor countries that they themselves did not implement during their time of take-off as “kicking away the ladder”.
Africa needs to industrialize for it to really rise. Unfortunately the rhetoric around “Africa rising” is giving us a false sense of comfort and distracting us from the real work that needs to happen.
Source:
http://africasacountry.com/is-africa-really-rising-history-and-facts-suggest-it-isnt/
Posted by OromianEconomist in Uncategorized.
Tags: Africa, African Studies, Economic and Social Freedom, Global Competitiveness Report, Sub-Saharan Africa


“Strong institutions, available talent, and a high capacity to innovate hold the key for the success of any economy. These elements will continue to be even more essential in the future.”
-GCI Report 2014-2015
“What Africa needs are strong Institutions Not Strong men.” -US President Barack Obama in Accra on his maiden visit to Africa as President .
“There is a monstrous relationship between the government and the citizen whereby the government is more powerful than the citizen” – Rev. Fr. Anthony Adewale, Prof. of Philosophy and Theology Dominican Institute in the Guardian of Sep 9, 2012.
“In the absence of institutions, strong men dominate, and the effect of their dominance is weakened rule of law and elevated uncertainty levels. Institutions have and follow rules, strong men have friends and follow whims. The outcome from one is calculable probability of outcomes; from the other uncertainty. Uncertainty makes decision making problematic and often results in either the avoidance of economic engagement or the high cost of hedging against undesired outcomes. These high transaction costs translate to uncompetitiveness for the economy. Even more troubling, high uncertainty which results in poor economic performance can create a class of people who are so left out they feel they have nothing to lose. With no stake in the social order they turned to conduct that more or less usher in anarchy, what Robert Kaplan quotes a Sierra Leonean Minister in The coming anarchy as dubbing ‘the revenge of the poor’.” – Pat Utomi
Ethiopia ranks 118th/ 144 in this year Global Competitiveness Index (GCI). The report says the country ‘facing challenges across all pillars despite its recent record growth rates. The functioning of its institutions (96th) receives a weaker assessment across almost all indicators, including property rights, ethics and corruption, and government efficiency. Furthermore, the country’s goods market (124th) remains inefficient. Ethiopia also requires significant improvements in the areas of infrastructure (125th), higher education and training (131st), and technological readiness (133rd). On a more positive note, this year points to a slight improvement in the country’s labor market, although concerns about the quality of labor-employer relations (97th), hiring and firing practices (78th), and the alignment between pay and productivity (99th) remain. Primary education, with a net enrollment rate of 86 percent, is comparatively good (although the quality of primary education requires improvement), and women account for a high percentage of the country’s labor force.’
According to the report, more than half of the 20 lowest ranked countries in the GCI are sub-Saharan Africa, and overall the region continues to under perform in many areas of the basic requirements of competitiveness: the infrastructure deficit remains profound, and despite gradual improvements in recent years, health and basic education remains low. Only a handful of sub-Saharan economies—the island states of Mauritius and Seychelles, in addition to Cape Verde—have noteworthy health and education systems. Higher education and training also need to be further developed to provide the skills required for higher-value-added growth. The region’s poor performance across all basic requirements for competitiveness stands in contrast to its comparatively stronger performance in market efficiency, where several of the region’s middle-income economies fare relatively well. Although large regional variations remain in terms of competitiveness—ranging from Mauritius, now a solid 17 places ahead of the second-ranked South Africa, to the lowest ranked Guinea at 144th—efforts to strengthen the very basic requirements for long-term growth will be crucial for sustaining economic growth and making it more inclusive. These efforts will need to emphasize closing the infrastructure deficit and providing the region’s (young) population with the necessary skills to carry out higher-value-added employment. Globally, Switzerland holds the number one spot, followed by Singapore and the United States. Finland and Germany both fell one notch, to the 4th and 5th. In this case, the top of the rankings continues to be dominated by highly advanced Western economies and several Asian tigers. For the sixth consecutive year Switzerland leads the top 10, and again this year Singapore ranks as the second-most competitive economy in the world. Overall, the rankings at the top have remained rather stable, although it is worth noting the significant progress made by the United States, which climbs to 3rd place this year, and Japan, which rises three ranks to 6th position. Brics economies presented a mixed performance, and China (28th, one place up compared to last year) leading the group ahead of Russia (53rd), South Africa (56th), Brazil (57th) and India (71st). The Global Competitiveness Report 2014-2015 assesses the competitiveness of landscape of 144 economies, providing insight into the drivers of their productivity and prosperity. The report series remains the most comprehensive assessment of national competitiveness worldwide. Read the full report @ http://www3.weforum.org/docs/WEF_GlobalCompetitivenessReport_2014-15.pdf
Report reveals sub-Saharan Africa’s 10 most competitive economies
http://www.howwemadeitinafrica.com/report-reveals-sub-saharan-africas-10-most-competitive-economies/43117/
Posted by OromianEconomist in Colonizing Structure, Corruption, Development, Dictatorship, Economics, Economics: Development Theory and Policy applications.
Tags: Africa, Corruption, Ethiopia, GCI, Global Competitiveness Report, Gross domestic product, Nigeria, Oromia, Oromo, Sub-Saharan Africa, World Economic Forum

The Corrupt Empire is uncompetitive: Ethiopia Is Amongst World’s Least Competitive Countries
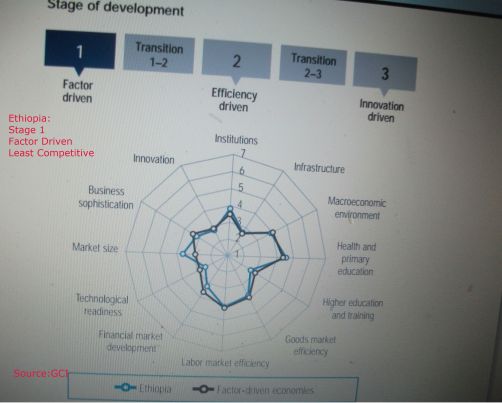
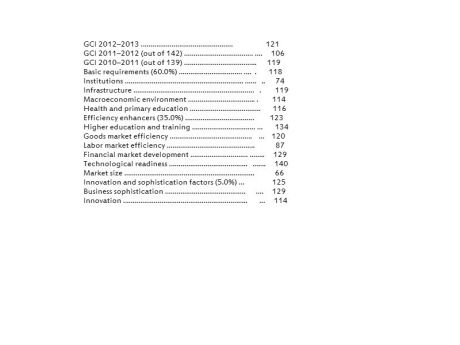
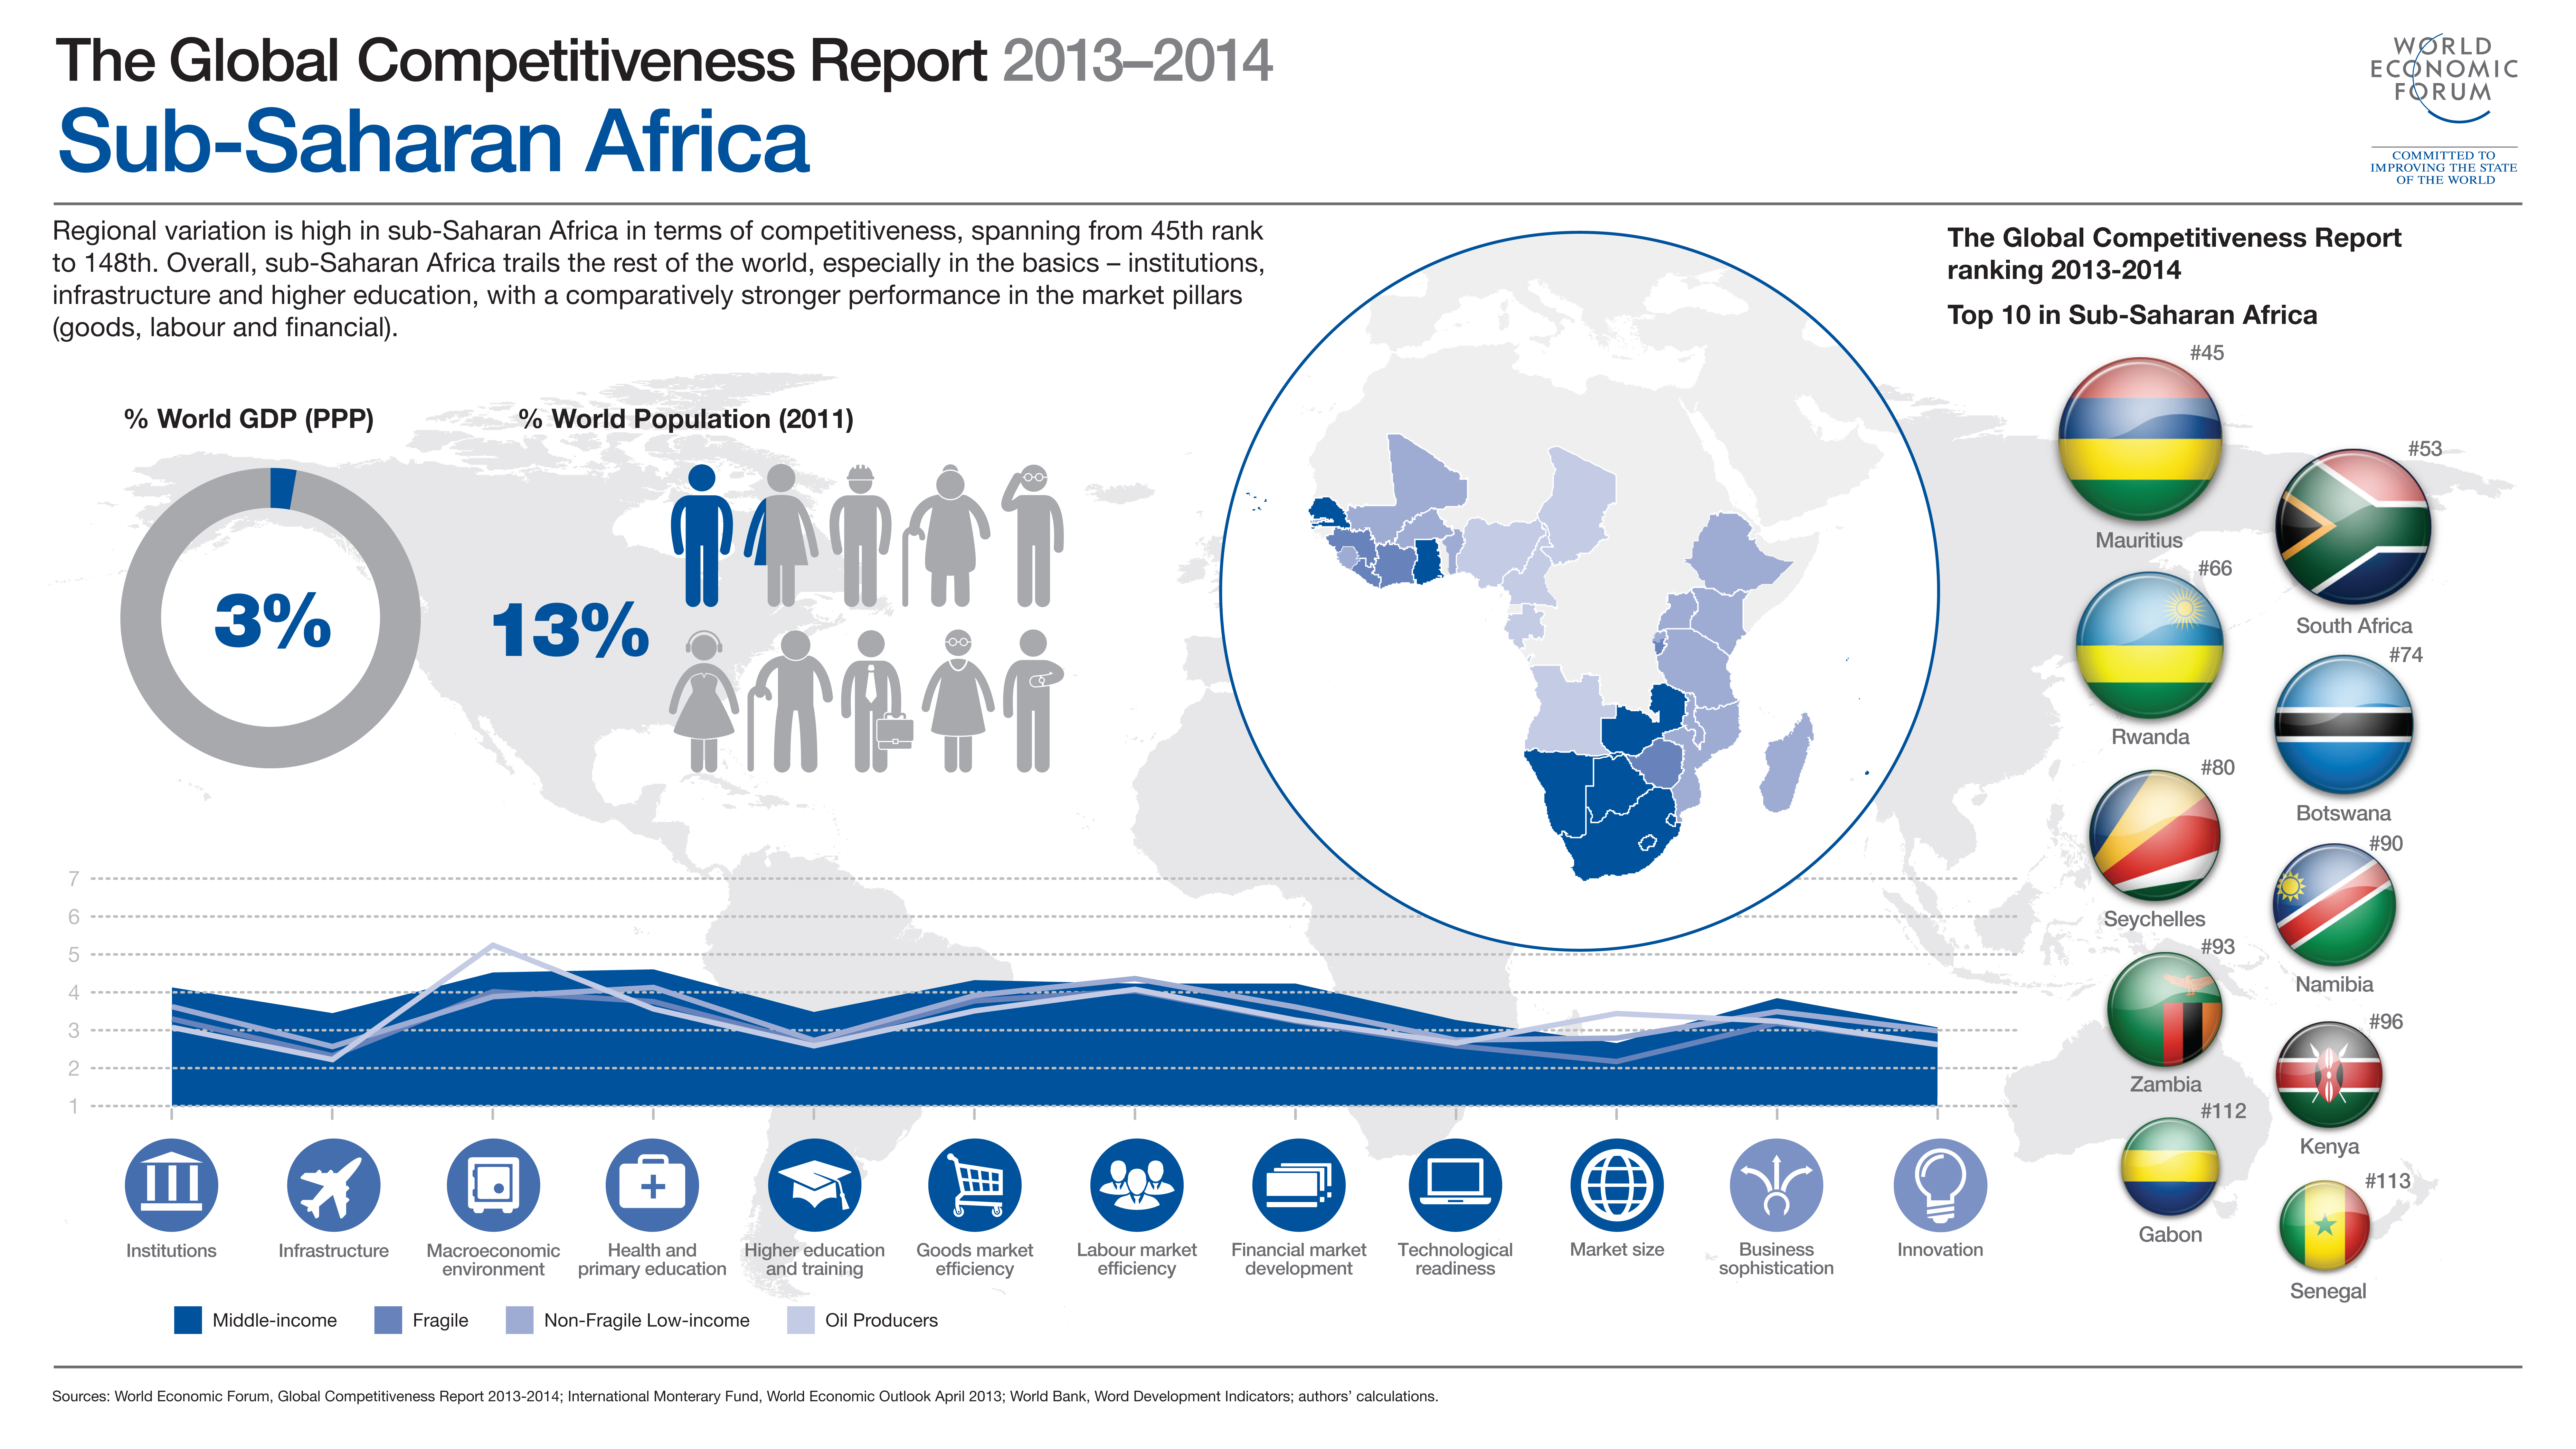
Despite its damn statistics of massive long term paper growth of TPLF Ethiopia’s economy, the country is still ranked among the worst performing in the Global Competitive Index (GCI) 2013 -2014, recently released by the World Economic Forum. (see page 163 for the detail summary of the report). According to the report, Ethiopia dropped 15 places from last year’s 106th position to 121st among the 144 countries profiled.
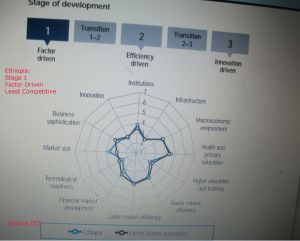
The Global Competitive Index , which was introduced in 2004, measures how the combinations of institutions, policies, and other factors determine the level of productivity of a country. The GCI scores is calculated by putting together the 12 pillars of competitiveness, such as: institutions, infrastructure, macroeconomic environment, health and primary education, higher education and training, goods market efficiency, labour market efficiency, financial market development, technological readiness, market size, business sophistication and innovation.
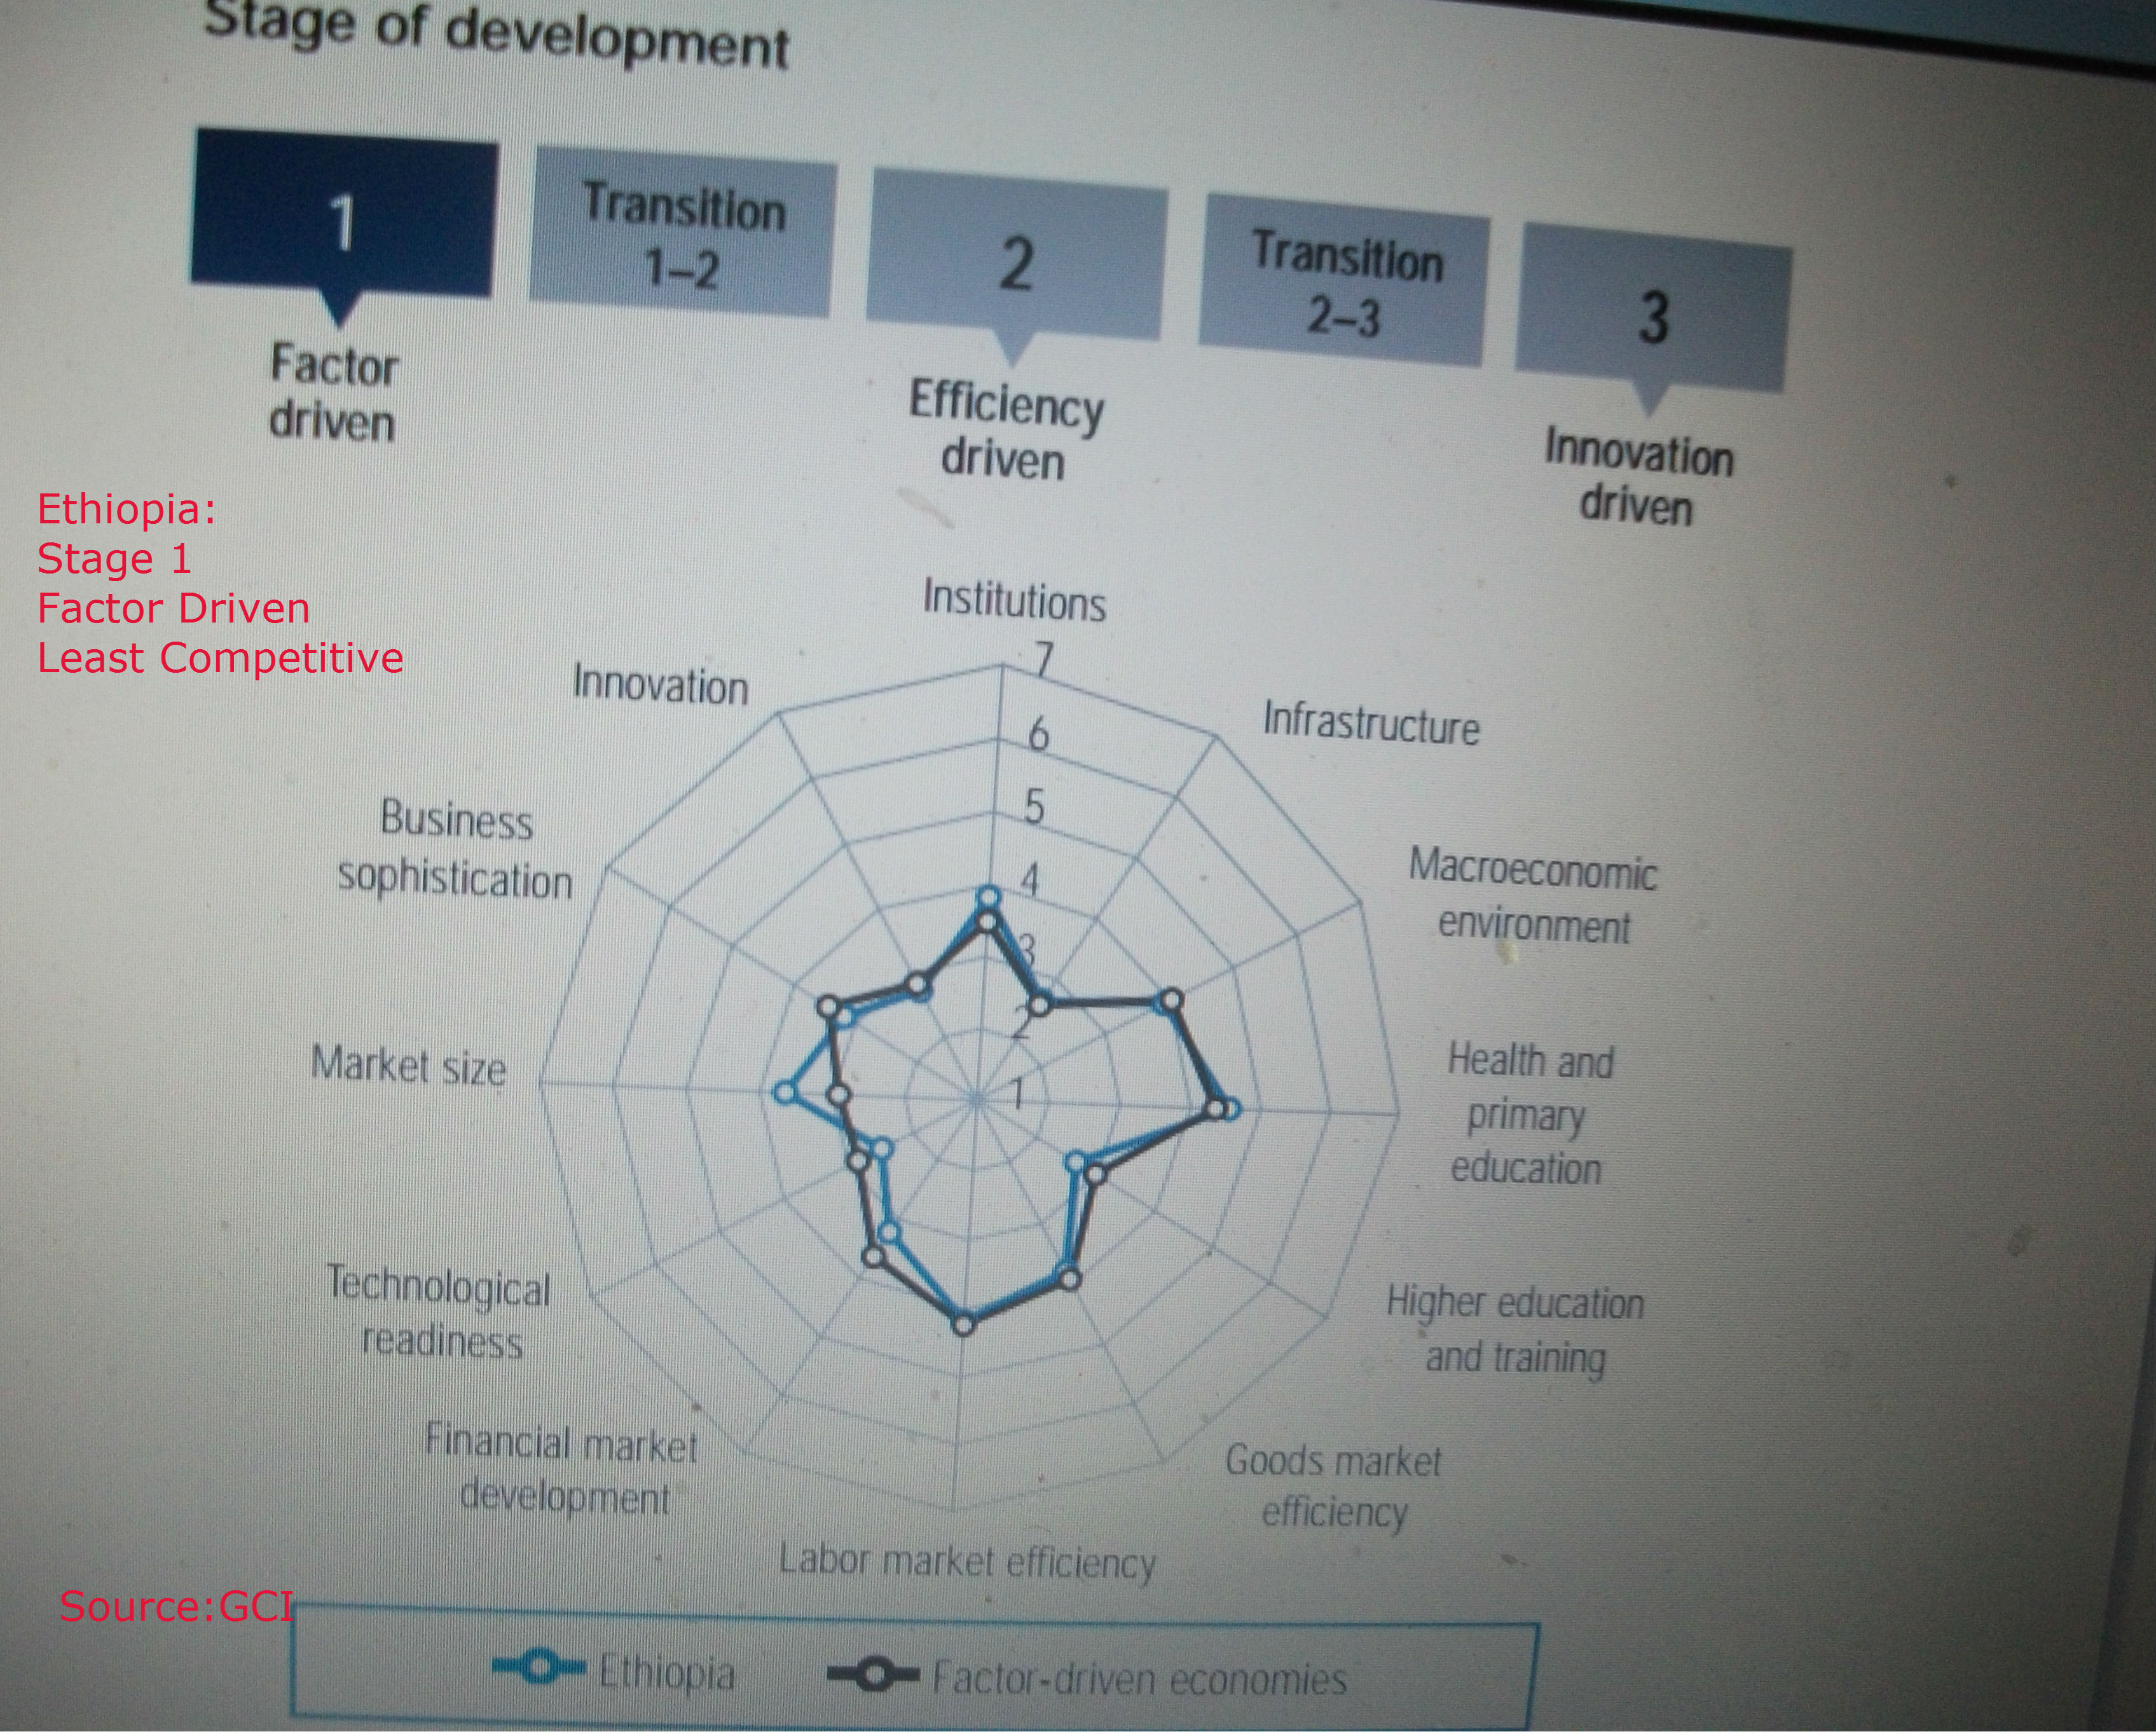
According to the ranking, Ethiopia is placed in the poorest pool of economic development possible (see, the following graphics). Ethiopia ranked as a “factor driven” economy which includes Nigeria, Liberia, Lao, Mali and Yemen.There are four stages of development with innovation-driven economies being the best pool of economies.
Ethiopian economic productivity is one of the poorest despite clear advantages of its internal market and economies of scale with population over 85 million compared to other African countries. Due to its population, it has a large internal market size (66 position), only next to Nigeria (the largest internal market size in Africa, also performing poor).
GCI has identified weak basic institutional requirements (118) of Ethiopia that account 60% of the index ranking: corruption, poor infrastructure, poor primary education, poor macroeconomic environment, efficiency enhancers and technological readiness.
The GCI has noticed with Ethiopia’s economy the following among the most problematic factors for doing business:
Access to finance, corruption, inefficient government bureaucracy, inflation, policy instability, tax regulations and inadequate supply of infrastructure.
Technological readiness is also the worst performance:
Availability of latest technologies (132)
Firm-level technology absorption (139)
FDI and technology transfer (128)
Individuals using Internet, % (142)
Broadband Internet subscriptions/100 pop (131)
Mobile broadband subscriptions/100 pop (120)
Ethiopia with a population of over 85 million only produces $31.7 billion GDP with per capita income of $1 per day.
Key indicators, 2011
Population (millions) ……………………………………….85.1
GDP (US$ billions)* ……………………………….. ………31.7
GDP per capita (US$) ……………………………….. …365.2
GDP (PPP) as share (%) of world total …………..0.12
Sectoral value-added (% GDP), 2011
Agriculture …………………………………………………. ..41.9
Industry ……………………………………………………… .12.6
Services ……………………………………………………. ..45.5
Human Development Index, 2011
Score, (0–1) best ………………………………………. ….0.36
Rank (out of 187 economies) ……………………………174
Sources: IMF; UNFPA; UNDP; World Bank and GCI
The report noted that Mauritius has replaced South Africa (53rd) as the most competitive country in Sub-Saharan Africa. Ranked 45th position the country moved up nine places this year.The country’s best performance has supported by “transparent public institutions (ranked at 39th) with clear property rights and strong judicial independence and an efficient government (29th).”
Switzerland, ranked at number one is the most competitive country in the world. For top ten Sab Saharan African countries See:
http://www3.weforum.org/docs/GCR2013-14/GCR_Infographic_SubSaharanAfrica_2013-2014.jpg
Click to access WEF_Africa_Competitiveness_Report_2013.pdf
Click to access WEF_Africa_Competitiveness_Report_2013.pdf
www3.weforum.org
http://www.economist.com/blogs/freeexchange/2013/09/commodity-price-decline?fsrc=scn/fb/wl/bl/amarxisttheoryissortofright
http://oromopress.blogspot.co.uk/2013/09/un-general-assemblyethiopias-leaders.html?fb_action_ids=622733174416698&fb_action_types=og.likes&fb_source=other_multiline&action_object_map=%7B%22622733174416698%22:592920940775374%7D&action_type_map=%7B%22622733174416698%22:%22og.likes%22%7D&action_ref_map=%5B%5D
Ethiopia’s Leaders Misinform the World
http://oromopress.blogspot.co.uk/2013/09/un-general-assemblyethiopias-leaders.html?fb_action_ids=622733174416698&fb_action_types=og.likes&fb_source=other_multiline&action_object_map=%7B%22622733174416698%22:592920940775374%7D&action_type_map=%7B%22622733174416698%22:%22og.likes%22%7D&action_ref_map=%5B%5D


You must be logged in to post a comment.