Economic and development analysis: Perspectives on economics, society, development, freedom & social justice. Leading issues in Oromo, Oromia, Africa & world affairs. Oromo News. African News. world News. Views. Formerly Oromia Quarterly
The problem with using statistics to sing the praises of autocracy is that collecting verifiable data inside closed societies is nearly impossible. From Ethiopia to Kazakhstan, the data that “proves” that an authoritarian regime is doing good is often produced by that very same regime.
Once regime-produced data makes it into the world’s most trusted indexes, authoritarians and their unintentional supporters use these numbers in their propaganda, which hampers efforts to promote human rights.
When Ethiopian prime minister Meles Zenawi died in 2012, Bill Gates led a chorus of Western praise for his development efforts, praising Zenawi for bringing millions out of poverty and ignoring his near-total censorship or his massacre of hundreds of protestors. The Economist and the The New York Review of Books have since pointed out that the Ethiopian regime fabricates development statistics.
Why Dictators Love Development Statistics
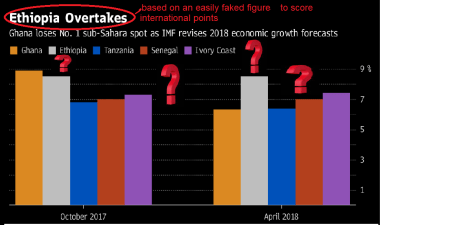
They’re an easily faked way to score international points.
Exchanges at the Organization of American States usually don’t do well on YouTube. But when the Honduran Minister of Foreign Affairs brought up Venezuela’s crackdown on dissent last summer, Venezuelan representative Delcy Rodríguez scored surprise points with a rebuttal citing the United Nations’ 2016 Human Development Index, which ranks Venezuela 59 spots higher than Honduras. Crackdown or no crackdown, “Venezuela does not demonstrate such terrifying statistics,” she said, in an exchange that soon went viral on Spanish-speaking social media. It was a win for the Maduro regime, and the key to victory was trusted U.N. data.
For those of us working to advance human rights, such episodes are becoming frustratingly familiar. From the development initiatives of Jeffrey Sachs and Bill Gates, to Tony Blair’s despotic partnerships or Tom Friedman championing Chinese autocracy in The New York Times, the last two decades have seen political concerns repeatedly sidelined by development statistics. The classic defense of dictatorship is that without the messy constraints of free elections, free press, and free protests, autocrats can quickly tear down old cities to build efficient new ones, dam rivers to provide electricity, and lift millions out of poverty.
The problem with using statistics to sing the praises of autocracy is that collecting verifiable data inside closed societies is nearly impossible. From Ethiopia to Kazakhstan, the data that “proves” that an authoritarian regime is doing good is often produced by that very same regime.
A handful of organizations power the global industry of statistics collection, including the World Bank, the United Nations, and the World Economic Forum. Each of these organizations conduct large-scale socio-economic surveys, where researchers want to include as many countries as possible. However, many of these countries—93 of them, comprising nearly 4 billion people, according to the Human Rights Foundation—are ruled by authoritarian regimes that typically block impartial investigators from entering their borders. Often, data collectors are forced to work with the strongmen in charge.
For Bahrain, the World Economic Forum receives most of its data from surveys given to government officials at the Bahrain Economic Development Board, who conduct them and give the results back to Geneva. In WEF’s analysis from that point, outliers may be cast out or excluded with data modeling, but the foundational numbers remain entirely a creation of the dictatorship.
UNESCO representatives say that in the case of Cuba, they use the regime’s education numbers in compiling their reports. There is no on-the-ground verification for these often-encouraging figures. Meanwhile, a former treasury official from Uzbekistan said that visits from international data collectors were highly choreographed, and that the regime was easily able to control survey outcomes.
When surveys don’t go according to plan, dictators can simply shut polling down. Gallup World Poll director Jon Clifton, when I called him up as part of a Human Rights Foundation interview several years ago, recalled a time when the company’s researchers had collected data in one African country, only to have their equipment seized at the airport on the way out.
Still, no one wants blank countries on their world maps. “Ultimately, organizations need to produce some kind of data,” Clifton said. “Even if it’s not terribly good, they still need data.”
But the development reports using such numbers also wind up giving them institutional legitimacy, in ways that can affect huge decisions in aid and trade. World Bank data in particular, as one 2012 study observed, is promoted in media outlets as a reputable guide for global investment, and has inspired reforms as countries seek to climb the rankings. UNESCO’s numbers go into the World Development Report (World Bank) and the Human Development Index (UNDP), where they serve, in UNESCO’s own words, to “benchmark progress towards national and international targets.” The educational components of the Sustainable Development Goals—which guide and inspire do-gooders and impact investors across the planet—are measured with UNESCO data. Statistics flow directly from many dictatorial governments to UNESCO and then into the SDG reports.
Once regime-produced data makes it into the world’s most trusted indexes, authoritarians and their unintentional supporters use these numbers in their propaganda, which hampers efforts to promote human rights.
When Ethiopian prime minister Meles Zenawi died in 2012, Bill Gates led a chorus of Western praise for his development efforts, praising Zenawi for bringing millions out of poverty and ignoring his near-total censorship or his massacre of hundreds of protestors. The Economist and the The New York Review of Books have since pointed out that the Ethiopian regime fabricates development statistics.
Halfway across the globe in Venezuela, the late Hugo Chávez built a global reputation as the people’s president, proudly flaunting statistics showing his administration had reduced poverty by 50 percent. In 2014, Chavismo heir Nicolás Maduro justified his crackdown on dissent—torturing and kidnapping student protesters—in a New York Times op-ed citing data showing that his regime “consistently reduced inequality,” “reduced poverty enormously,” and “improved citizens’ lives over all.” The source of that data? The U.N. Economic Commission for Latin America and the Caribbean, which used Millennium Development Goal data—which came directly from the regime’s own statisticians.
In Azerbaijan, Ilham Aliyev’s dictatorship has used economic growth data to convince the world that it is a thriving, effectivegovernment with a robust investment climate. The World Economic Forum, among others, gave the Azeri regime a platform to talk about its financial success—which is used to whitewash crimes ranging from the jailing of dissidents to the theft of billions.
Rwandan dictator Paul Kagame’s human rights violations are legion: the assassination of critical journalists, sponsorship of death squads in the Congolese jungle, the use of international hitmen, and the jailing of political opponents. Despite all this, supporters ranging from Bill Clinton to Jeffrey Sachs breathlessly praise his leadership and economic success. When Kagame “won” 99 percent of the presidential vote a few months ago, the international community was quick to call that political data into question. But Rwanda’s literacy rates, life expectancy, and economic growth numbers continue to be taken at face value.
This near-universal lack of skepticism is hard to explain, especially since the problem isn’t new. In 1987, two Soviet economists published an article called Lukavaya Tsifra(“cunning numbers”) which demonstrated that between 1928 and 1985, the USSR’s GDP had grown over ten times slower than reported by the regime’s Central Statistical Administration. They showed that the regime’s “official” economic data was being falsified to whitewash human suffering.
When used by universities and research institutions, socio-economic data sets guide our fundamental understanding of the world. When used by policy makers, philanthropists, and bankers, they steer billions of dollars of aid and investment. Often, the reason data from dictators remains unchallenged is that so many economists, financiers, diplomats, and donors rely on it to do their jobs.
But without more rigorous inquiry into the origin and quality of socio-economic data, the grim reality of dictatorship often remains obscured. Beyond that, intellectuals and world leaders might do well reflect on their worship of development numbers over human rights concerns.
After all, even if the data behind the UN’s 17 Sustainable Development Goals could be verified, what do they signify if not a single one mentions the words individual rights, civil liberties, or democracy—even once? Numbers aren’t always as simple or as neutral as they seem.
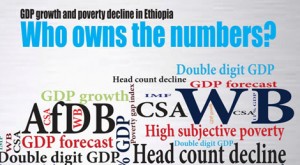
Ethiopia: Double Digit Growth or Collapsing Economy?
Analysis by Andualem Sisay, All Africa, 8 April 2016
Ethiopian government’s increasing reliance on foreign loans is posing a serious risk of economic collapse, a renowned economist has revealed.
“Take for instance China, which has loaned over $17 billion to the Ethiopian government for infrastructure projects. Our total investment is 40 per cent of the GDP. Our saving is between 10-20 per cent of the GDP.
“We import $13 billion and export $3 billion. They are the ones who are filling all these deficit gaps,” said Dr Alemayehu Geda.
The Addis Ababa and London universities don was presenting his paper on Foreign Direct Investment (FDI) in Ethiopia and Credit Financing.
“What will happen if they stopped such financing tomorrow? What if, for instance, the Chinese government tomorrow says sell for me Ethio Telecom or sell to me Ethiopian Airlines or give me some share or buy my aeroplanes, or I will stop such credit financing?
Strategic items
“The country will collapse, I guarantee you,” he said.
Dr Alemayehu went on: “About 77 per cent of our imports are strategic items. Fuel only has 25 per cent share of the total import. As a result, even if we want to reduce these imports, we can’t. Ethiopia needs to minimise strategic vulnerability.”
The don elaborated giving the example of how the Koreans mitigated against such dependency risks when they used to source 75 per cent of their imports from the US some decades ago.
Dr Alemayehu presented his paper in Addis Ababa at the launch of a two-year 12 series of public dialogue by the Forum for Social Studies – a local civil society, partially financed by the UK’s Department for International Development (DfID).
“The Koreans came out of such vulnerability risk after analysing their situation properly, discussing the issue with their intellectuals and setting long term plans,” he said, advising the Ethiopian government to invest in quality education, skilled labour and improve the negotiations capacity as well as have in place a well-designed policy.
Last decade
Official estimates have shown the Ethiopian economy growing by double digits annually for about a decade now, a figure that has highly been doubted by independent scholars.
The Addis government has been applauded for growing the country’s GDP by around 10 per cent per year for the last decade.
In his paper, Dr Alemayehu indicated that Ethiopia’s external loan included $17.6 billion from China for various infrastructure developments, around $3 billion from Turkish and close to $1 billion from Indian governments.
The World Bank’s data shows that from 2012 – 2016, Ethiopia has taken a total loan of close to $6 billion from the global lender. Last year, Ethiopia for the first time, joined Euro Bond and accessed $1.5 billion.
In addition to loans, reports show that some $3 billion annually came to the country in the form of aid from donors.
Have declined
Ethiopia’s exports have declined from around $3 billion last year to around $2.5 billion this year, as revealed in the recent six-month report of the prime minister to the parliament.
Even though tax collection has been growing by an average of 20 per cent annually over the past five years, Ethiopia’s tax to GDP ratio still stands at 13 per cent, which is less than the around 16 per cent of the sub-Saharan average.
Last year, Ethiopia collected around $6 billion from tax, including $25 million recovered from contraband traders. The figure could have been raised by at least $3 billion had it not been for the generous tax incentives the country has provided to investors, according to latest report of the Ethiopian Revenue and Customs Authority (ERCA).
In only nine months of Ethiopia’s last budget (July 8, 2014 – July 7, 2015), the country provided tax incentives of around $2.4 billion to investors, by exempting them from customs and excise duties and withholding, VAT and surtaxes, according to ERCA’s report.
Financial integrity
A financial integrity report last December indicated that around $2 billion was leaving Ethiopia every year through mis-invoicing and other tax frauds.
When it comes to the FDI coming from China, India and Turkey, close to 71 per cent of their investments in Ethiopia were in the manufacturing sector.
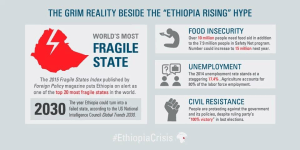
However, job creation, technology transfer and export contribution were insignificant for Ethiopia, which has over an 90 million population dominated by the youth. The country has about 16 per cent unemployment rate, according to Dr Alemayehu.
Between 2003-2012, there were 93 Chinese companies that had reportedly invested $600 million, creating around 69,000 permanent and 79,000 temporary jobs for Ethiopians. There was little contribution to technology transfer and foreign currency generation through the exportation of their products.
According to Dr Alemayehu’s paper, during the same period, Indian investments in Ethiopia created 24,000 and 26,000 permanent and temporary jobs respectively, while 341 Turkish companies operating in Ethiopia created a total of 50,000 jobs.
Though much was being talked about Chinese investments growing in Africa, the Asian giant had less than 4 per cent of total share of FDI on the continent, out of the total stock of $554 billion worth in 2010. Most of the investments in Africa were still dominated by the Western companies, according to Dr Alemayehu.
Prime Minister Hailemariam Desalegn recently told the local media that Ethiopia’s GDP growth was not expected to record a double digit this year and would likely drop to around 7 per cent.
However, his special economic adviser with a ministerial docket, Dr Arkebe Equbay, reportedly told Bloomberg media that the economy was expected to grow by 11 per cent this year.
Foreign debts
The government was now expected to deal with puzzles such as why the economic performance was not as good as in the previous years, with all the generous incentives to investors and huge infrastructure investments mainly dependent on local and external loans?
How to repay its local and foreign debts before the lenders force the government to cede shares in its highly protected businesses, such as, Ethio Telecom, Ethiopian Airlines, the Commercial Bank of Ethiopia, the Ethiopian Insurance Corporation and Ethiopian Shipping Lines is, for sure, the elephant in the room.
But the big question is: How soon will these issues get the attention of a government pre-occupied with trying to feed about a dozen million people affected by drought and dealing with political unrest and conflicts mainly in Oromia and Gondar area of Amhara Region?
Ethiopia’s fake economic growth borrows from ENRON’s accounting
J Bonsa analyses Ethiopia’s economic growth over the last ten years. Africa At LSE
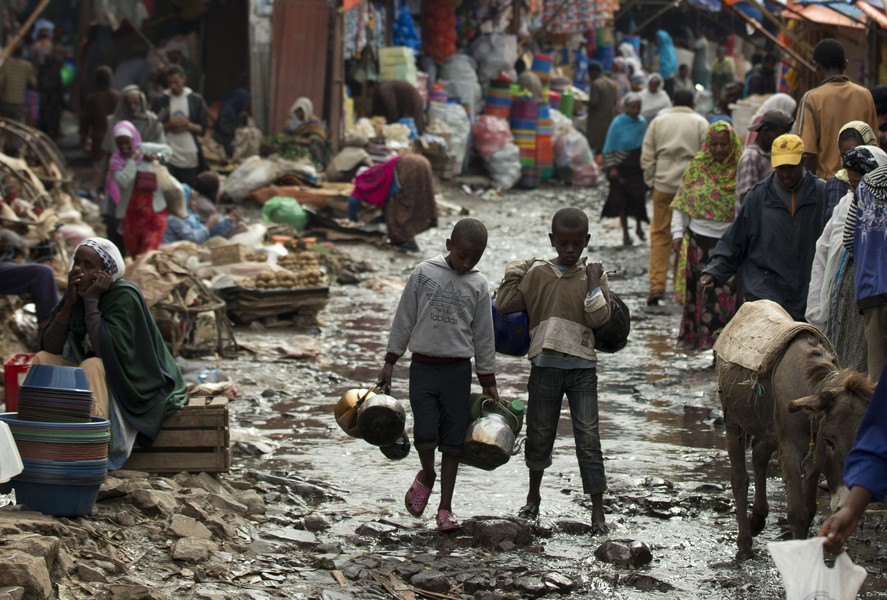
More than 70 people have been killed and dozens wounded in an ongoing crackdown on peaceful protesters in Oromia. One of the underlying causes of the prevailing tense political situation is Ethiopia’s bogus claim about “miraculous” economic growth in the last decade.
The youth is not benefitting from the country’s supposed growth and doesn’t anticipate the fulfillment of those promises given the pervasive nepotism and crony capitalism that underpins Ethiopia’s developmentalism.
Courtesy: OPride
The ruling Ethiopian People’s Revolutionary Democratic Front (EPRDF) came to power in 1991 and briefly experimented with democratic transition. However, a little over a decade into its rule, the party’s former strongman, the late Meles Zenawi, realized that their pretentious experiment with liberal democracy was not working. Zenawi then crafted a dubious concept called, “developmental state.”
Stripped of the accompanying jargon and undue sophistication, Zenawi was simply saying that he had abandoned the democratic route but would seek legitimacy through economic development guided by a strong hand of the state. This was a ploy, the last ditch attempt to extend EPRDF’s rule indefinitely.
Using fabricated economic data to seek legitimacy and attract foreign direct investments, the regime then advanced narratives about its double-digit economic growth, described with such catchphrases as Ethiopia rising, the fastest growing economy in the world and African lioness. The claims that EPRDF has delivered economic growth at miraculous scales has always been reported with a reminder that it takes several decades to build democratic governance. The underlining assumption was that, as long as they deliver economic growth, Ethiopia’s leaders could be excused on the lack of democracy and human rights abuses associated with the need for government intervention in the economy.
EPRDF spent millions to retain the services of expensive and well-connected Western lobbying firms to promote this narrative and create a positive image of the country. These investments were also accompanied with a tight grip on the local media, including depriving foreign reporters’ access if they cross the government line. Ethiopia’s communication apparatus was so successful that even serious reporters and analysts started to accept and promote EPRDF’s narrative on rapid economic growth.
However, a few recent events have tested the truthfulness of Ethiopia’s economic rise. Drought and the resulting famine remain the Achilles heels of the EPRDF government. The government can manipulate data on any other sector, including the aggregate Gross Domestic Product, and get away with it, but agriculture is a tricky sector whose output is not so easy to lie about. The proof lies in the availability of food in the market, providing the absolute minimum subsistence for the rural and urban population.
The sudden translation of drought into famine raises serious questions. For example, it is proving difficult to reconcile the country’s double-digit economic growth with the fact that about 15 million Ethiopians are currently in need of emergency food aid.
Rampant famine
Except for some gullible foreign reporters or parachute consultants, who visit Addis Ababa and depart within days, serious analysts and students of Ethiopian economy know that authorities have often fabricated economic statistics in order to generate fake GDP growth. To the trained eye, it does not take a lot to find inconsistencies in the data series. In fact, Ethiopia’s economic growth calculus is so reminiscent of Enron accounting. (See my recent pieces questioning EPRDF’s economic policies, including anomalies in the alleged achievements of millennium development goals, crony businesses, devaluation, external tradeand finance.)
The tacit understanding in using GDP as a measure of economic growth is that responsible governments generate such data by applying viable international standards and subjecting the data to scrutiny and consistency checks.
Unfortunately, these standards are not foolproof; irresponsible governments with mischievous motives can abuse them. There is credible evidence that shows Ethiopian authorities deliberately inflated economic statistics to promote feel-good, success stories.
Let’s take the agricultural data, which is timely and topical given the ongoing famine. This came to light recently as the European Union tried to understand anomalies in Ethiopia’s grain market, particularly persistent food inflation which the EU found incompatible with the agricultural output reported by the Central Statistical Authority (CSA) of Ethiopia.
The EU’s Joint Research Centre (JRC) then developed the technical specification for studying the scope of the Cereal Availability Study in order to account for the developments in the Ethiopian cereal markets. The International Food Policy Research Institute (IFPRI) was selected to carry out the study.
Figure 1 (above) compares the EU-sponsored survey and the Ethiopian government’s survey produced by the CSA. I am using the data for 2007/08 for comparison. The negative numbers indicate that the IFPRI estimates were consistently lower than the CSA data. For instance, CSA overstated cereal production by 34 percent on average. This ranged from 29 percent for maize to 44 percent for sorghum. The actual amount of Teff produced is lower by a third of what’s reported by the CSA.
The research team sought to explain this “puzzle” by examining the sources of the confusion, the methodological flaws that might have led CSA to generate such exaggerated economic data. Toward that end, they compared CSA’s crop yield estimates with comparable data from three neighboring countries: Kenya, Tanzania, and Uganda (see Figure 2).
From 2000 to 2007, the average increase in cereal yield for these countries, including Ethiopia, was 19 percent. Yet the CSA reported a whopping 66 percent for Ethiopia’s yield growth. The country was not experiencing an agricultural revolution to justify such phenomenal growth. It is unrealistic that Ethiopia’s yield growth would be greater than the neighboring East African countries, particularly Kenya, where the agricultural sector is at a much more advanced stage. If anything, the reality in Ethiopia is closer to Uganda, which did not report any yield increase during that period.
This reveals the extents of data manipulation by Ethiopian authorities to create an inexistent economic success story and seeks political legitimacy using a bogus record. We now know the widespread distortions in official statistics on cereal production thanks, in no small part, to EU’s intervention in sponsoring a study and explaining the disparities. Cereals represent only a sub-sector in the agricultural realm. It is likely that worse distortions would be revealed if similar studies were done on Ethiopia’s growth statistics in other sectors, including manufacturing and service divisions.
‘Poverty reduction’
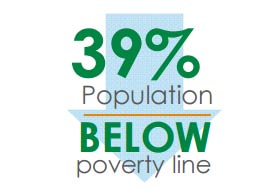
The IMF has praised Ethiopia for achieving accelerated growth with a focus on equity and poverty reduction, a challenging dilemma for most countries. However, a closer look at three interconnected facts turns this claim on its head.
First, as noted above, Ethiopia’s agricultural output has been inflated by 34 percent on average. Second, a33 percent poverty reduction since 2000 is widely reported. Third, there is a consensus that poverty reduction has happened mostly in rural Ethiopia. Now we put these three facts together and apply a simple logic to establish that the 33 percent poverty reduction is explained by the 34 percent exaggerated agricultural outputs. Notice that it is not by accident that the two percentage points are almost identical. Therefore, the ups and downs cancel each other out. In the best-case scenario, poverty rate must remain at the same level as in 2000.
The World Bank, IMF and other donors have often anchored their conclusions on poverty reduction on alleged changes in the agricultural sector, where the bulk of the poor live and work. Little do they know that the data they used to compute the poverty index comes from agricultural statistics with hugely inflated yield assumptions as shown above.
This raises the question: where has the billions of dollars in bilateral and multilateral aid pumped into Ethiopia in the name of poverty reduction and the millennium development goals gone?
‘The enclave economy’
The ‘Ethiopia rising’ storyline is a standard set by foreign correspondents who often repurpose official government press releases, or reports based on the construction projects in the capital, Addis Ababa.
For example, Bloomberg Africa’s William Davison, often uses the proliferating high-rise buildings in Addis Ababa as tangible evidence of Ethiopia’s double-digit economic growth. In his latest whitewash, Davison writes, “such growth is already visible in parts of the capital, where shopping malls and luxury hotels are sprouting up.” That a veteran reporter for a business website unashamedly passes judgment on economic success by referring to heights and width of buildings underscores his shallow understanding of the country’s social and political fabric.
Here are some of the questions that reporters aren’t asking and seeking answers for: Who owns those building? Where did the investment money come from? Are there any firm linkages between these physical infrastructures and the rest of the Ethiopian economy? I have partially answered some of these questions in a previous piece and will soon provide additional insights.
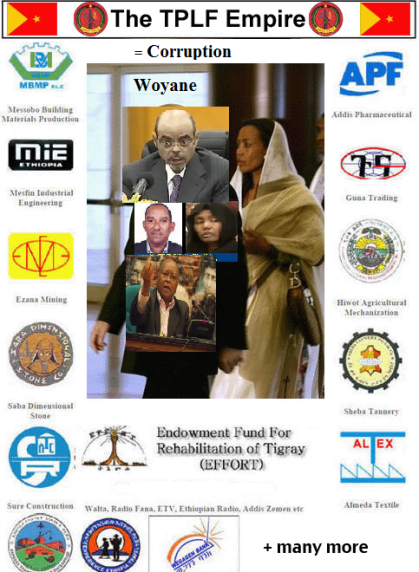
For now, I would like to draw attention to the existence of an “enclave economy” within the mainstream Ethiopian economy. This enclave is made up of highly interconnected crony businesses, which are owned and operated by Tigrean elites, who also have a tight grip on the political and military command structures. Take, for example, the Endowment Fund for Rehabilitation of Tigray (EFFORT), a business conglomerate affiliated with the Tigrean People’s Liberation Front (TPLF). EFFORT has its humble origin in the relief and rehabilitation arm of the TPLF. However, it has undergone amorphous growth and now controls the commanding heights of the Ethiopian economy. By some estimates, EFFORT now controls more than 66 business entities.
The EFFORT controlled enclave and related military engineering complexes have created a semi-autonomous economy in Ethiopia. They made smart choices and specialized in engineering and construction businesses. This means they do not have to rely on the Ethiopian public for their products; instead, each specialize in separate industrial branches and buy from each other and also sell to the government, which is also in their hand. The huge government infrastructural projects necessitated by the “developmental state” model create business opportunities for these engineering companies.
The enclave economy is only loosely linked to the mainstream economy and it does not benefit the bulk of the Ethiopian people in any meaningful way. The luxury hotels and supermarkets that Davison refers to cater for the needs of the affluent business classes, their families, and the expatriate community.
In other words, Ethiopia’s miraculous economic growth, if it in fact exists, must have happened only in the enclave economy. Statistically, it is possible to generate a double-digit economic growth at the national level through a combination of some real astronomical growth in the enclave component and stagnation or declines hidden, through some accounting tricks, in the rest of the economy.
Lock-in style of reporting
Unfortunately, the unquestioned reporting on Ethiopia’s economic success has continued. Even the EU study appears to have been shelved, or deliberately ignored despite the significant findings. Even as a fifth of the population is in need of emergency aid, the World Bank is sticking with the outdated data and has recently released a sensationalized report entitled “Ethiopia’s Great Run: the growth acceleration and how to pace it.”
The ensuing famine has shaken the foundation of Ethiopia’s growth narrative, yet western NGOs and media outlets appear to suffer from the lock-in effect in adopting consistent storylines. They continue to link and refer to the World Bank, IMF and others reports and indexes by multilateral organizations.
That’s why we continue to see comical headlines such as “Ethiopian Drought Threatens Growth as Cattle Die, Crops Fail,” which assumes that Ethiopia’s growth is actually occurring. This acquiescence does not only display ignorance, but it also underscores an effort to evade accountability for previous mistakes and failure to report accurate information.
In a recent interview with The Ethiopian Reporter, Prime Minister Hailemariam Desalegn made a rare and fateful admission: “if we crave for too much praise for our achievements, we might run the risk of undermining the challenges we are facing. These challenges could grow bigger and become irreversible and that would be detrimental.”
Over the past 25 years, the EPRDF worked tirelessly to create a distorted image of the country and began craving and lobbying foreigners for praises.
Enron’s success involved an elaborate scam, but the firm was named “America’s Most Innovative Company” for six consecutive years. This fame did not stop Enron from crumbling. EPRDF’s fate will not be any different. The Oromo uprising has already started the unraveling of its elaborate scams devised to attain legitimacy on the back of non-existent economic and democratic advancement.
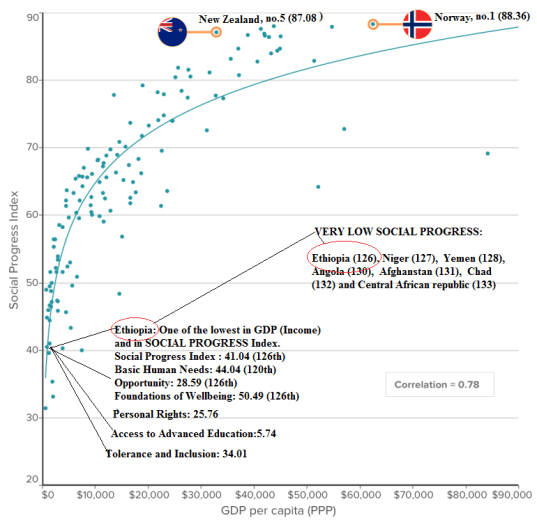
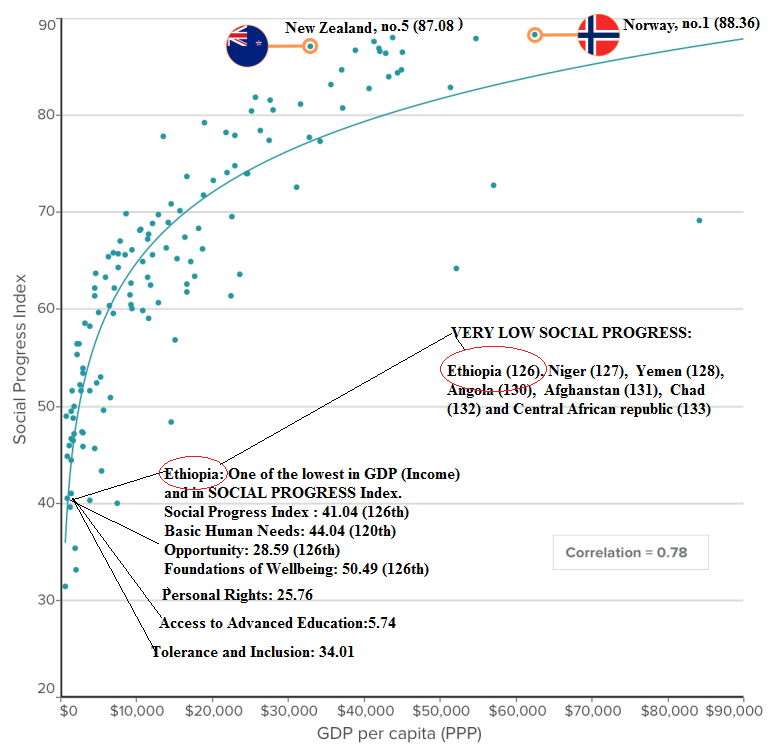
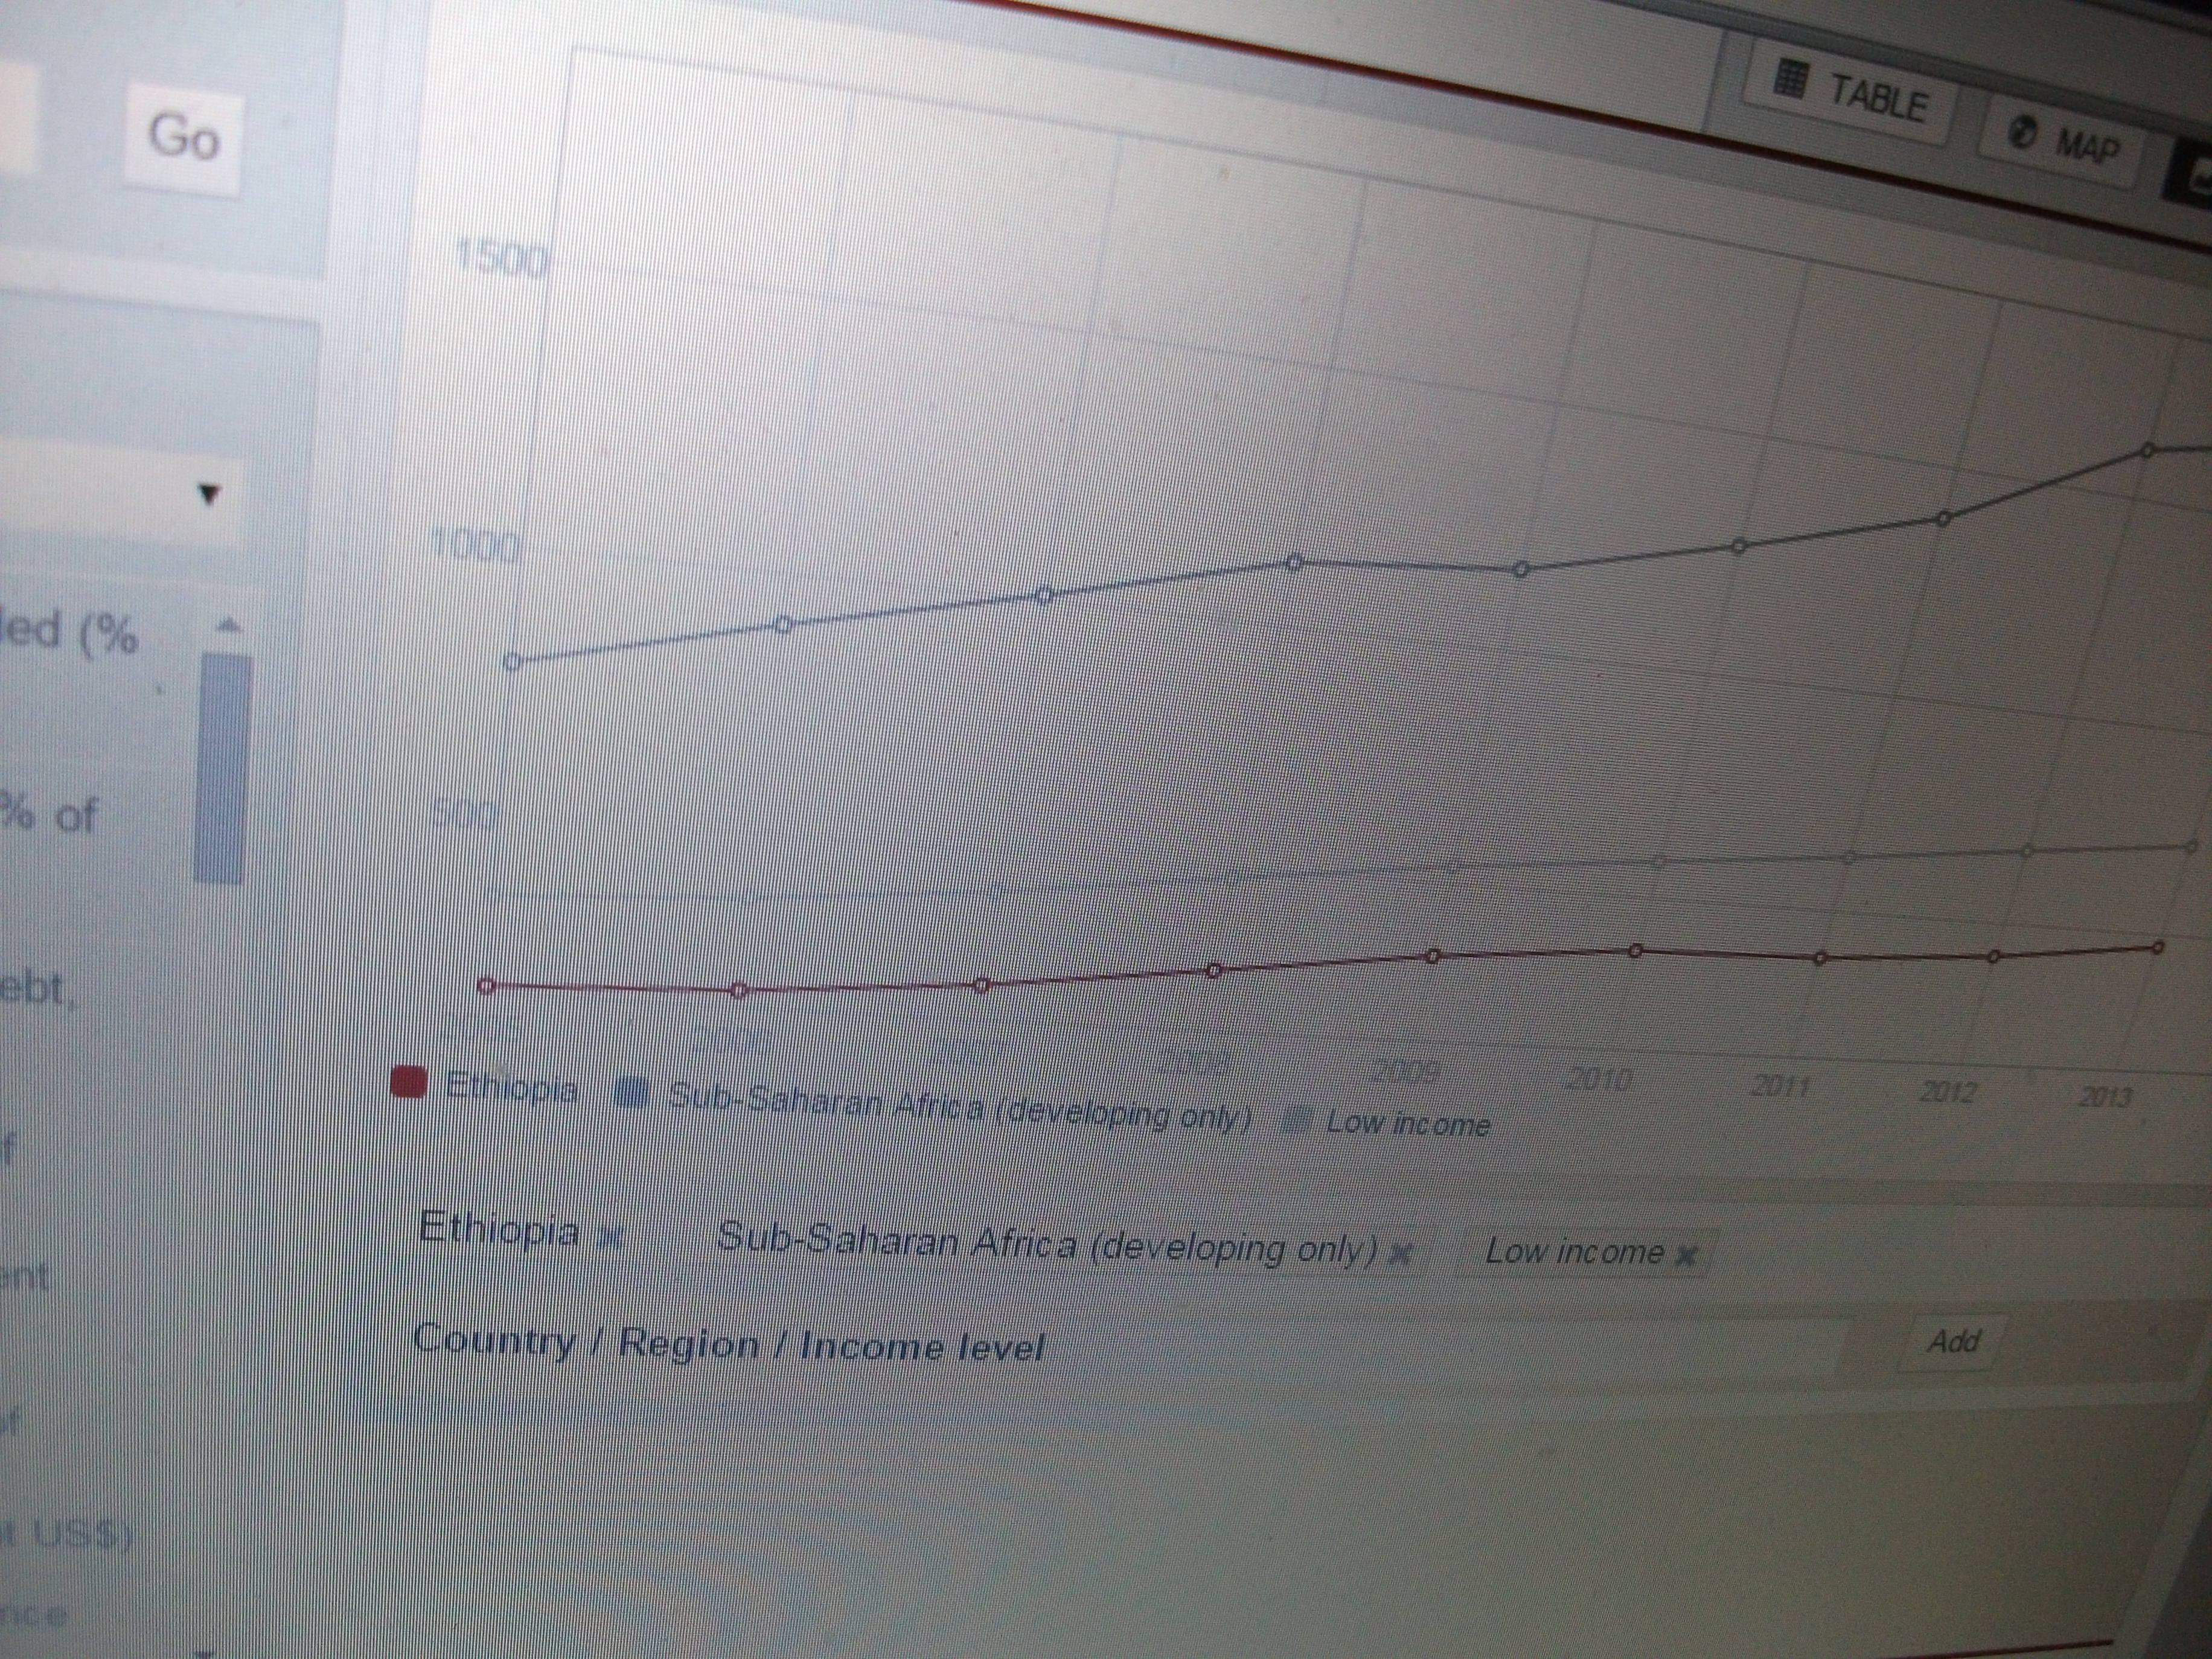
Sub-Saharan African countries are the poorest regions of Africa and the world. The World Bank’s Per Head Income trend from 2005 shows that Ethiopia’s trend is by far below Sub-Saharan Africa average trends with constantly widening gap. With Per Capita Income of below $500 throughout the trends, World Bank data shows that Ethiopia’s trend has been below the averages of world’s low income countries. So, what is the point of Ethiopia’s ‘fastest growth’ hype?
GNI per capita, Atlas method (current US$) GNI per capita (formerly GNP per capita) is the gross national income, converted to U.S. dollars using the World Bank Atlas method, divided by the midyear population. GNI is the sum of value added by all resident producers plus any product taxes (less subsidies) not included in the valuation of output plus net receipts of primary income (compensation of employees and property income) from abroad. GNI, calculated in national currency, is usually converted to U.S. dollars at official exchange rates for comparisons across economies, although an alternative rate is used when the official exchange rate is judged to diverge by an exceptionally large margin from the rate actually applied in international transactions. To smooth fluctuations in prices and exchange rates, a special Atlas method of conversion is used by the World Bank. This applies a conversion factor that averages the exchange rate for a given year and the two preceding years, adjusted for differences in rates of inflation between the country, and through 2000, the G-5 countries (France, Germany, Japan, the United Kingdom, and the United States). From 2001, these countries include the Euro area, Japan, the United Kingdom, and the United States. -World Bank national accounts data, andOECDNational Accounts data files
‘We live in a era of big data, but developing countries are suffering from a data drought: governments and the international community know less about the world’s poorest than they think….While the World Bank estimates that the number of people living on less than $1.25 a day is 1.01 billion, the report claims the number could be up to 350 million more than that…The report, which was based mostly on secondary research, publicly available databases, and original interviews, also claims that maternal mortality figures for sub-Saharan Africa in 2013 could be double the stated 133,000, and the number of people living with HIV/AIDS could have been overstated by 20%…“We take for granted that statistics are based on fact, and that they’re scientific or empirical when often they’re not—they’re estimations or political negotiations,” Elizabeth Stuart, a research fellow at the ODI tells Quartz…There are many reasons for this data dearth. Populations in developing countries often live either in highly spread out or dense, shifting communities like urban slums, making traditional data collection methods, such as censuses and household surveys, expensive, too infrequent and potentially dangerous. Over 40% of countries in sub-Saharan Africa have not had a survey in seven years.’
On September 30th Kenya announced that it had revised its GDP upwards by 25%. Earlier this year Nigeria’s National Bureau of Statistics made an even bigger splash when a similar exercise showed the Nigerian economy to be 89% bigger than previously thought, displacing South Africa’s as the continent’s largest economy.
In 2011 the African Development Bank (ADB) declared that not only was Africa rising, but that statistics on income distribution revealed a sizeable middle class now comprising 34% of Africa’s population—or nearly 327m people. Earlier that year, The Economist announced that IMF forecasts predicted that seven of the ten fastest-growing economies in the world over the next five years would be in Africa. In 2010 Ghana revised its GDP by 63%.
These statistical earthquakes, while good news, have shattered trust in Africa’s numbers. Shanta Devarajan, chief economist of the World Bank’s Africa region, called it “Africa’s statistical tragedy” when he reflected on the quality and availability of quantitative evidence in the aftermath of Ghana’s GDP revision.
In retrospect it may seem puzzling that bewilderment has greeted what has essentially been good news – Africa’s economies and its middle class are bigger than we thought. But, for too long, we have neglected the accuracy of African economic statistics. We are only now waking up to the size of the knowledge gap because suddenly the numbers on African economies matter.
Investors and social scientists rely on accurate measurements. If 327m middle-class Africans really existed, investors would consider Africa a potentially lucrative market for making deals in real estate,retail, wholesale and communications. These huge numbers would force social science scholars to redefine and jettison hackneyed development phrases such as “subsistence”, “informal economies”, “food security” and “poverty eradication”.
However, the AfDB’s 2011 report conceded that about 60% of Africa’s middle class, approximately 199m people, were barely out of poverty. This startling admission was based on its expansive definition of the middle class: individuals who spend between US$2 and $20 daily.
For political scientists, the middle class is the backbone of a democratic society. In Marxist theory the rise of the bourgeoisie permits progressive modernisation and industrialisation. For investment banks, multinational corporations, real estate developers and traders, the middle class is defined by purchasing power and signifies a potentially untapped market.
For this reason, a more accurate definition of the middle class requires a higher purchasing-power bracket that shows that households are living beyond subsistence and that its members are also high school and university graduates.
Researchers affiliated with international organisations and investment banks have also tried counting Africa’s middle class. Some surveys, such as accounting firm EY’s 2012 Africa by numbers report, dance around the actual size, and prefer instead to refer to “a growing middle class”. Similarly, The rise of the African consumer, a 2012 report from McKinsey, a consulting and research company, stays out of the numbers game altogether and never mentions the middle class. Standard Bank released a report in June assessing 11 sub-Saharan economies, or half this region’s total GDP, to measure the size of the continent’s middle class.
Based on these reports, the size of Africa’s middle class stretches from as few as 15.7m households, as estimated by McKinsey, to the 327m people the AfDB assessed in 2010. Completely different monetary definitions of the middle class drive these differences. The AfDB’s bottom threshold of $2 per day is much lower than McKinsey’s $55, Standard Bank’s $23 or the $10 per day used by the OECD, a Paris-based intergovernmental think-tank. In addition, the OECD and AfDB report their statistics in total number of people, while McKinsey and Standard Bank report on households without specifying their size.
It may appear puzzling that Standard Bank defines the middle class as households that spend between $8,500 and $42,000, while McKinsey’s 2010 Lions on the move report defines this group as households that spend above $20,000 a year. This can be reconciled: McKinsey includes all households above $20,000 in disposable income. This means that they also count very rich households, which explains why their estimate is higher.
In its other report, The rise of the African consumer, McKinsey contends that 40% of spending-power growth will come from households that earn above $20,000 annually. They note that “this group currently accounts for just 1-2% of total households” but that this income cluster is “growing faster than the overall average, both in numbers and in average income”.
So what are we left with? We went from a middle class that represents 34% of Africa’s population to one that represents 1-2%. But this tiny group is not middle class: they are very rich households that have the fastest-growing incomes. Ultimately, what we are seeing is not a pyramid bulging in the middle as in the picture drawn by the AfDB. The numbers from McKinsey and Standard Bank describe a society where the top spenders are getting richer. This may be good news for some banks and investors, but it does not carry the same connotations for social scientists.
None of the above, however, explains how these numbers were calculated or whether they are trustworthy. It is highly likely that many of the GDP growth numbers exaggerate actual increases in productivity and improvements in living standards.
Both Ghana’s and Nigeria’s GDP ballooned following the introduction of new benchmark years for estimating GDP in 2010 and 2014. How confident can one be about a 7% growth rate in a country likeNigeria when almost half of the economy was missing in the official baseline?
Some commentators proclaim that Africa is growing faster than its outdated measurements suggest. Indeed, some countries’ economies are larger than those shown by these old numbers. But that does not mean that recent growth has been faster too. The opposite is likely.
An outdated baseline means that “new” growth is more than likely “previously unrecorded” growth. When the base is too small, the proportion of economic growth will be overstated. Moreover, when statisticians and politicians know that their numbers are minimising total GDP, it is tempting to add a bit each year to pre-empt a large upwards revision when the GDP numbers are ultimately corrected.
GDP growth estimates are also misleading because only parts of the economy are recorded. Changes in exports and foreign direct investment are quantifiable and easily measured, while other important sectors that may be moving less quickly, such as food production, often remain unobserved.
In developed countries, like Norway, individuals’ and companies’ income, production and expenditure are reasonably well recorded and available through administrative records. The government routinely collects this information as part of its day-to-day operations.
In poorer countries, few companies and even fewer individuals, households and farms record or report income, production and expenditure. To get a measure of how income is distributed in a country and how many people earn less than $2 a day requires drawing a graph with income on the X-axis and population on the Y-axis. On such a graph the share of households that earn below $2, $3 or $4 a day can be seen, as well as the income ratio of the top 1% and bottom 10%.
Drawing this graph presumes this information is reliable. In practice, however, these numbers are mostly non-existent because data collection is expensive and time consuming. The most common audit, the Living Standards Measurement Study, is used by the World Bank to obtain poverty statistics. It requires each household to spend a day filling out a long questionnaire. A typical survey with a sample of about 2,000 households costs a few million dollars. From data collection to dissemination takes another two years.
According to a May 2013 report by the Brookings Institution, a Washington, DC-based think-tank, six of sub-Saharan Africa’s 49 countries have never conducted a household survey and only 28 countries have done one in the past seven years. Surveys measuring social indicators such as health and demographics have similar gaps. Moreover, only about 60 countries in the world have vital registration systems required to monitor trends in social indicators, and none of these are in Africa, according to an article by Amanda Glassman, a senior fellow at the Washington, DC-based think-tank Center for Global Development. Any statement about the size and direction of poverty and income in the world, particularly in Africa, relies on many assumptions and extrapolations, a practice that can lead to gross inaccuracies.
Reports on the size of Africa’s middle class highlight these presumptions and (mis)calculations. The Standard Bank report, which provides a conservative estimate of the size of the middle class, is based on a sample of 11 sub-Saharan African countries. The problem is that data availability is not random – it is biased because we know more about the richer economies, such as Nigeria and Ghana, than we know about poorer, more problematic countries such as the Democratic Republic of Congo, Somalia or Côte d’Ivoire. Another complication is that we do not know how Standard Bank determined middle-class growth rates for years that lack official information on income distribution, nor how it dealt with the very well-known discrepancies and incoherencies in Nigeria’s household surveys.
It is undeniable that more goods are leaving and entering the African continent today than 15 years ago. But does the increase in the volume of transactions result in a sustained lift in living standards? Some might argue that a positive African narrative and the power of self-fulfilling prophecies can make the vision of a huge middle class in Africa come true.
A fact-based outlook, however, is the best path. Does Africa’s population really have more spending power? Are fewer Africans hungry?
The evidence on income distribution does not provide accurate answers. Everyone wants to know if the continent is better off, but proclaiming that it is without solid proof may backfire – particularly if poverty reduction and income distribution are slower and more unequal than what has been publicised. Impartial and inaccurate numbers too often lead to poor policy decisions.
Read more @ http://gga.org/stories/editions/aif-28-making-up-the-middle/who2019s-counting


You must be logged in to post a comment.