The 2015 annual Prosperity Index:Ethiopia ranks 126, coming in at 17 of the bottom 20 least most prosperous countries, and 137th in a sub-category that measures Entrepreneurship & opportunity. Theranking has named Norway as the world’s most prosperous economy. November 5, 2015
Posted by OromianEconomist in Uncategorized.Tags: Africa, economics, Ethiopia & The Global Innovation Index, Ethiopia and social progress index, Prosperity index, The 2015 annual Prosperity Index, The 2015 annual Prosperity Index:Ethiopia ranks 126
add a comment

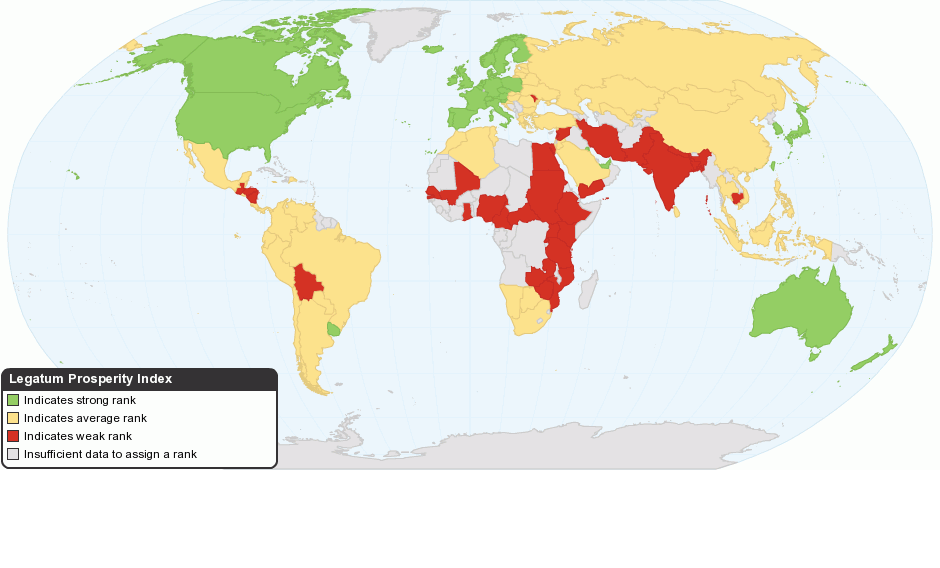
Ethiopia ranked 126 out of 142 countries on a new prosperity index, and 137th in a sub-category that measures Entrepreneurship & opportunity. The index ranked Ethiopia 132nd in education.
The index was released by the London based The Legatum Institute on 2nd November 2015. According to the institute, the index assesses how prosperous an economy is based on more than just macroeconomic factors – it also takes into account wellbeing. Using rigorous research and in-depth analysis, the Index ranks countries based on their performance in eight sub‐indices—Economy, Entrepreneurship & Opportunity, Governance, Education, Personal Freedom, Health, Safety & Security and Social Capital.
The Index assesses 142 countries, representing more than 96% of the world’s population and 99% of the world’s GDP.
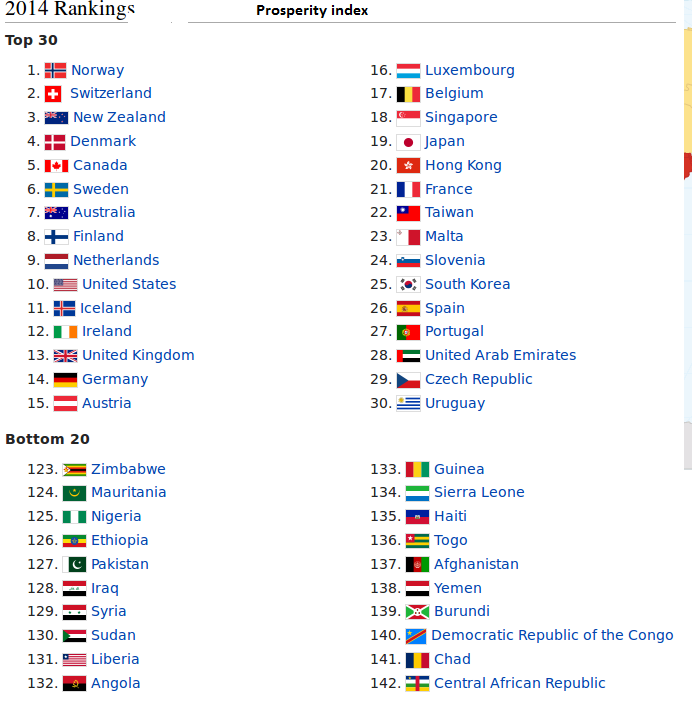
The latest ranking has named Norway as the world’s most prosperous economy. Norway topped the list for the seventh consecutive year. Along with Norway, three other Scandinavian countries (Denmark, Sweden, and Finland) made the top 10, and Iceland (another Scandinavian country) coming in at number 12, behind the United States, in the top 20.
Ethiopia ranks 126, coming in at 17 of the bottom 20 least most prosperous countries. Ethiopia is ranked between Nigeria (125th) and Republic of Congo (127). The bottom 20 nations are mostly sub Saharan African countries, with the exception of countries like Afghanistan (141), Syria (136), Yemen (135), Pakistan (130), and Iraq (123).
The least prosperous nation of all the 142 nations sampled for the second year in a row is the Central African Republic.
In terms of specific sub categories of performance, the following countries were ranked number 1 in the world:
1. Economy: Singapore
2. Entrepreneurship & Opportunity: Sweden
3. Governance: Switzerland
4. Education: Australia
5. Health: United States
6. Safety & Security: Hong Kong
7. Personal Freedom: Canada
8. Social Capital: New Zealand
See interactive rankings table in the following link:-
Economic Freedom Index 2015: Ethiopia is ranked 37th out of 46 countries in the Sub-Saharan Africa region, and its overall score continues to be below the regional average.Ethiopia’s economic freedom score is 51.5 July 27, 2015
Posted by OromianEconomist in Corruption, Free development vs authoritarian model.Tags: Africa, Ethiopia, Ethiopia & The Global Innovation Index, Ethiopia and the social progress index, Ethiopia: TPLF's corruption empire, Political & Economic Corruption
1 comment so far
‘State institutions are dominated by ruling EPRDF officials who reportedly receive preferential access to credit, land leases, and jobs. Under the government’s “villagization” program, hundreds of thousands of indigenous people have been forcibly relocated to new villages with inadequate infrastructure so that the state can lease their lands to commercial agricultural foreign investors.’
Ethiopia’s economic freedom score is 51.5, making its economy the 149th freest in the 2015 Index. Ethiopia is ranked 37th out of 46 countries in the Sub-Saharan Africa region, and its overall score continues to be below the regional average.
With a large domestic market and promising economic prospects, Ethiopia has the potential to become a regional economic powerhouse, but persistent state intervention in the relatively closed economy has suppressed the growth of economic freedom over the past five years.
Overall, the institutional basis of economic freedom in Ethiopia is still weak. A nominally independent judiciary continues to follow government policy advice, and corruption remains endemic. The government has made significant investments in major development projects, including the Grand Renaissance Dam, but restricts foreign investment in major industries and keeps important sectors of the economy closed to global trade and investment.
Ethiopia has had 10 years of steady economic growth, but not enough to reduce poverty. Its per capita income remains among the world’s lowest. Ethiopia is a leading coffee producer. Its economy is largely based on agriculture and is vulnerable to droughts and external shocks.
RULE OF LAW
Corruption is a significant problem in Ethiopia. State institutions are dominated by ruling EPRDF officials who reportedly receive preferential access to credit, land leases, and jobs. Under the government’s “villagization” program, hundreds of thousands of indigenous people have been forcibly relocated to new villages with inadequate infrastructure so that the state can lease their lands to commercial agricultural foreign investors.
LIMITED GOVERNMENT
Ethiopia’s top individual income tax rate is 35 percent, and its top corporate tax rate remains at 30 percent. Other taxes include a value-added tax and a tax on capital gains. The overall tax burden equals 11.6 percent of the domestic economy, and government spending accounts for 16.9 percent of gross domestic product. Public debt equals 22 percent of annual production.
REGULATORY EFFICIENCY
Inconsistent enforcement of regulations often impedes business activity and undermines economic development. The minimum capital requirement for launching a business is higher than the level of average annual income. Much of the labor force is employed in the informal sector. Monetary stability has been weak, and subsidies for the government’s state-led development model are hindering private-sector growth.
OPEN MARKETS
Ethiopia has a 10.3 percent average tariff rate. It is not a member of the WTO, and government procurement processes can favor domestic companies. Foreign investment is heavily regulated. There is no constitutional right to own land. The small financial sector continues to evolve and is largely dominated by banks. The capital market remains underdeveloped, and there is no stock exchange.

Read more At:-
http://www.heritage.org/index/country/ethiopia
ETHIOPIA: IS TPLF GOVERNING OR EXPANDING IT’S CORRUPTIONS EMPIRE?
Baankiin Addunyaa, Dinagdeen Itoophiyaa waggoota sadan dhufan gadi bu’a jedhe. July 12, 2015
Posted by OromianEconomist in Ethiopia the least competitive in the Global Competitiveness Index, Poverty.Tags: Africa, Ethiopia & The Global Innovation Index, Ethiopia and poverty, Ethiopia and social progress index, Ethiopia's higher-education boom built on shoddy foundations
add a comment

(OMN: Oduu Adol.12,2015): Guddinni dinaagdee Itoophiyaa waggoota sadan dhufan keessatti,harka lamaan akka gadi bu’uu Baankiin Addunyaa gabaase. Baankiin Addinyaa gadi bu’uu guddinna dinaagdee Itoophiyaa kan hime, gabaasaa bara 2015 guddina diinagdee Itoophiyaa ilaalchisuun baaseen akka ta’e barameera.
Gabaasni waggaa kanaa baankiin addunyaa guddina diinagdee Itoophiyaa ilaalchisuun baase akka mul’isutti, guddinni diinagdee Itoophiyaa,waggoota itti’aanan kanatti ni dabala jedhamee eegamaa ture qabxii lamaan akka gadi bu’u baankiin Addunyaa himeera.
Gabaasni Baankiin Addunyaa kun, sababaa gadi bu’iinsaa diinaagdee Itoophiyaa yoo himu, sochiileen investimeetiifi konistraakshiinii qabbana’uun isaanii qancaruu diinaangdeef kanneen duraati jechuun Baankii Addunyaatti, itti gaafatamaan sagantaa diinaagdee Laarsi Moolar dabbataneeran.
Gaabasni baankii Addunyaa kun itti dabaluun akka beeksisetti, sochiin daldala biyya alaa qabbana’a dhufuusaatiin humni maallaqa sharafa biyya alaafi baajanni fiisikaala mootummaalle rakkoo keessa seenuun, sochii daldala biyya alaatiifi biyya keessaa giddutti madaalliin duufuun sharafni biyya alaa dhabamuun diinaagdee Itoophiyaa rakkoo keessa akka galchu addeeffameera.
Liqaan biyyootaa alaa Itoophiyaa irra jirulle, dhibeentaa 45 irraa gara 65 tti akka ol guddatu gaabsni baankii addunyaa kun saaxileera. Liqaa biyyoonni alaa Itoophiyaa irraa qaban kana kan akka malee ol kaasaa jiru, liqaa baroota dheeraafi dhala gadi bu’aa waliin kanfalamurra, liqaan yeroo gabaabaa keessatti kafalamuufi dhala hedduu dhalu heddummaachaa waan dhufeef akka ta’ee gabaasni Baankii Addunyaa kun addeesseera. Gabaa Addunyaa irratti dabalaa dhufuun humnni jijjiirraa doolaralle, liqaa ittoophiyaa irra jiru ol kaasaa jira jedhameera. Gatiin doolaara yeroo gabaabaa keessatti dhibeentaa 25n dabalaa akka dhufe ragaaleen agarsiisanii jiran.
Gabaasaan Daani’eel Bariisoo Areerii.
Ethiopia’s higher-eduction boom built on shoddy foundations, George West, The Guardian June 25, 2015
Posted by OromianEconomist in Ethiopia the least competitive in the Global Competitiveness Index, Free development vs authoritarian model, Schools in Oromia, The Global Innovation Index, Uncategorized.Tags: Africa, African Studies, Education and Development, Ethiopia & The Global Innovation Index, Ethiopia's higher-education boom built on shoddy foundations, Oromo University Students And Their National Demand, Weak institution
add a comment
The country desperately needs new universities to drive development, but most of the 30 built in the last 15 years fall woefully short
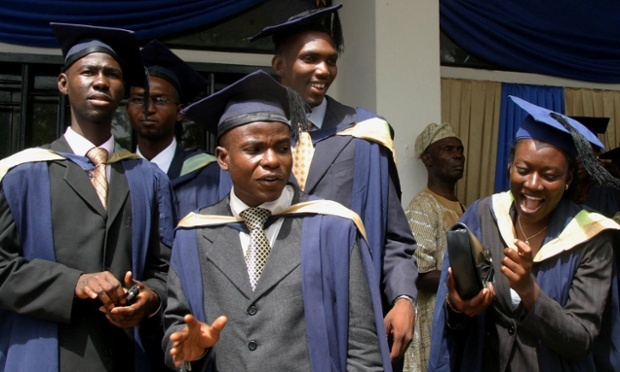
The declining standard of Nigeria’s premier institution, the University of Ibadan, ten years ago is reflected in Ethiopia where the quality of new universities varies widely. Photograph: George Esiri/REUTERS
Ethiopia’s higher education infrastructure has mushroomed in the last 15 years. But the institutions suffer from half-written curriculums, unqualified – but party-loyal – lecturers, and shoddily built institutions. The rapid growth of Ethiopia’s higher education system has come at a cost, but it is moving forward all the same.
Twenty years ago the Ethiopian government launched a huge and ambitious development strategy that called for “the cultivation of citizens with an all-round education capable of playing a conscious and active role in the economic, social, and political life of the country”. One of the principal results of Ethiopia’sagricultural development-led industrialisation strategy (ADLI) has been a rapid expansion in the country’s higher education system. In 2000 there were just two universities, but since then the country has built 29 more, with plans for another 11 to be completed within two years.
The quality of these new universities varies widely; from thriving research schools, to substandard institutions built to bolster the regime’s power in hostile regions. One professor recalls a hurried evacuation from part of a recently completed university while he was working there: one of the buildings had collapsed.
But there have also been success stories. The University of Jimma, for example, has come first in the Ethiopian Ministry of Education’s rankings for the past five years, and is held up as evidence of ADLI’s efficacy since its establishment in 1999. The most recent development at Jimma, the department of materials science and engineering (MSE), opened for students in 2013, and has quickly expanded to become one of the top research schools in the sub-Saharan region. The department’s founder, Dr Ali Eftekhari, has since received a fellowship from the African Academy of Sciences on the back of the project’s success.
This success is much-needed. At 8%, African higher education enrolment issignificantly lower than the global average of 32%, and Ethiopia trails even further behind, with fewer than 6% of college-age adults at university. Research in science, technology, engineering, and mathematics (Stem) is starting from a particularly low base in Africa. The World Bank reported last year that though the sub-Saharan region has “increased both the quantity and quality of its research” in recent years, much of this improvement is due to international collaboration, and a lack of native Africans is “reducing the economic impact and relevance of research”.
Dr Eftekhari echoes these concerns: “The problem for development in Ethiopiaand similar African countries is higher education itself. This is the reason that I focused on PhD programs. “For instance, Jimma’s department of civil engineering has over 3,000 undergraduate students. These civil engineers are the future builders of the country, but there is not one PhD holder among the staff; most only have a BSc.”
Eftekhari improvised and sweet-talked in order to get the department established; in its first year, the department taught 18 PhD students – all native Ethiopians – on almost zero budget, with staff donating their time and money until funding was secured from the ministry of education. Despite the Ethiopian People’s Revolutionary Democratic Front’s (EPRDF) push for development, Ethiopia’s political landscape remains a minefield for education professionals, says Eftekhari: “People are always suspicious about the political reasons behind each new project. I decided to start with zero budget to allay those doubts. In developing countries everything has some degree of flexibility. I used this to borrow staff and resources from the rest of the university until we could secure a budget.
“Many of the staff saw the project as a career opportunity,” says Eftekhari, but altruism also played a part. The department’s research focuses primarily on solving the country’s pressing poverty and development problems. “They knew they were actually saving lives,” says Jimma’s innovation coordinator, Maria Shou.
The belief that science and engineering is key to alleviating poverty propels the work of the school. Projects range from the development of super-capacitors for the provision of cheap power, to carbon nanomaterials for Ethiopia’s expanding construction industry. “You only need a couple of weeks in Ethiopia to realise that materials science is a priority,” says Pablo Corrochano, an assistant professor at the school. “Even in the capital you’ll experience cuts in power and water; in rural areas it’s even worse. Producing quality and inexpensive bricks for building houses, designing active water filters, and supplying ‘off-the-grid’ energy systems for rural areas are all vital to the country’s development.”
However, Jimma’s success could be seen as a bit of an anomaly. Paul O’Keeffe, a researcher at La Sapienza University of Rome, who specialises in Ethiopia’s higher education system, believes that similar initiatives are needed, but that the government’s politics are an obstacle: “My research indicates that the rapid expansion of the public university system has seen a dramatic decline in the quality of education offered in recent years. Instead of putting resources into improving the existing system, or establishing a few good institutions, the EPRDF has built many new universities, largely for political reasons.
“A lot of the time the universities are merely shells. They do not function as universities as we would expect and are poorly resourced, and in some cases shoddily built. It would seem that they are built almost as a token where the EPRDF can say to hostile regions ‘look we are doing something for you, we’ve built a university’.”
Even when the universities do function, the quality of education is often low: “Once the funding, say from a western development agency, is finished for a particular course, it is no longer taught as the university authorities believe they can get funding for a new course instead; whatever is the latest fashionable course. So often this type of education for development is not sustainable.”
Reports of spies, classroom propaganda, of curriculums that have been abandoned half-written due to funding cuts, and of unqualified staff are common at these universities, which make up the bulk of Ethiopian higher education, says O’Keeffe. “The party line is peddled during class, students are required to join the party, [there are] various reports of spies in the classrooms, who monitor what is said and who says it.”
A lecturer at Addis Ababa University, who wished to remain anonymous, is concerned primarily with the lack of qualifications among staff: “What is disturbing is that those who have just graduated with BAs and MAs are the lecturers. That is the manpower that they have. If you talk with students you wouldn’t believe that these students actually graduated from these so-called universities. Their inability to articulate their thoughts is breathtaking. It is extremely frustrating and you wonder how they have spent four years at university studying a doctorate.”
In this context, the MSE school provides a beacon of hope. The school’s success demonstrates that higher education – Stem research in particular – has the potential to thrive and play a central role in helping Ethiopia to reach its goal of becoming a middle-income nation by 2025, provided political interests are put to one side. Let’s hope the EPRDF takes note.
Ethiopia: GNI per capita , Atlas method (current US$) June 24, 2015
Posted by OromianEconomist in Africa Rising, Youth Unemployment.Tags: 2015 Global Economic Prospects, Africa, Africa is not rising, Africa's statistics, Developing country, Ethiopia & The Global Innovation Index, Ethiopia and the social progress index, Ethiopia: TPLF's corruption empire
add a comment
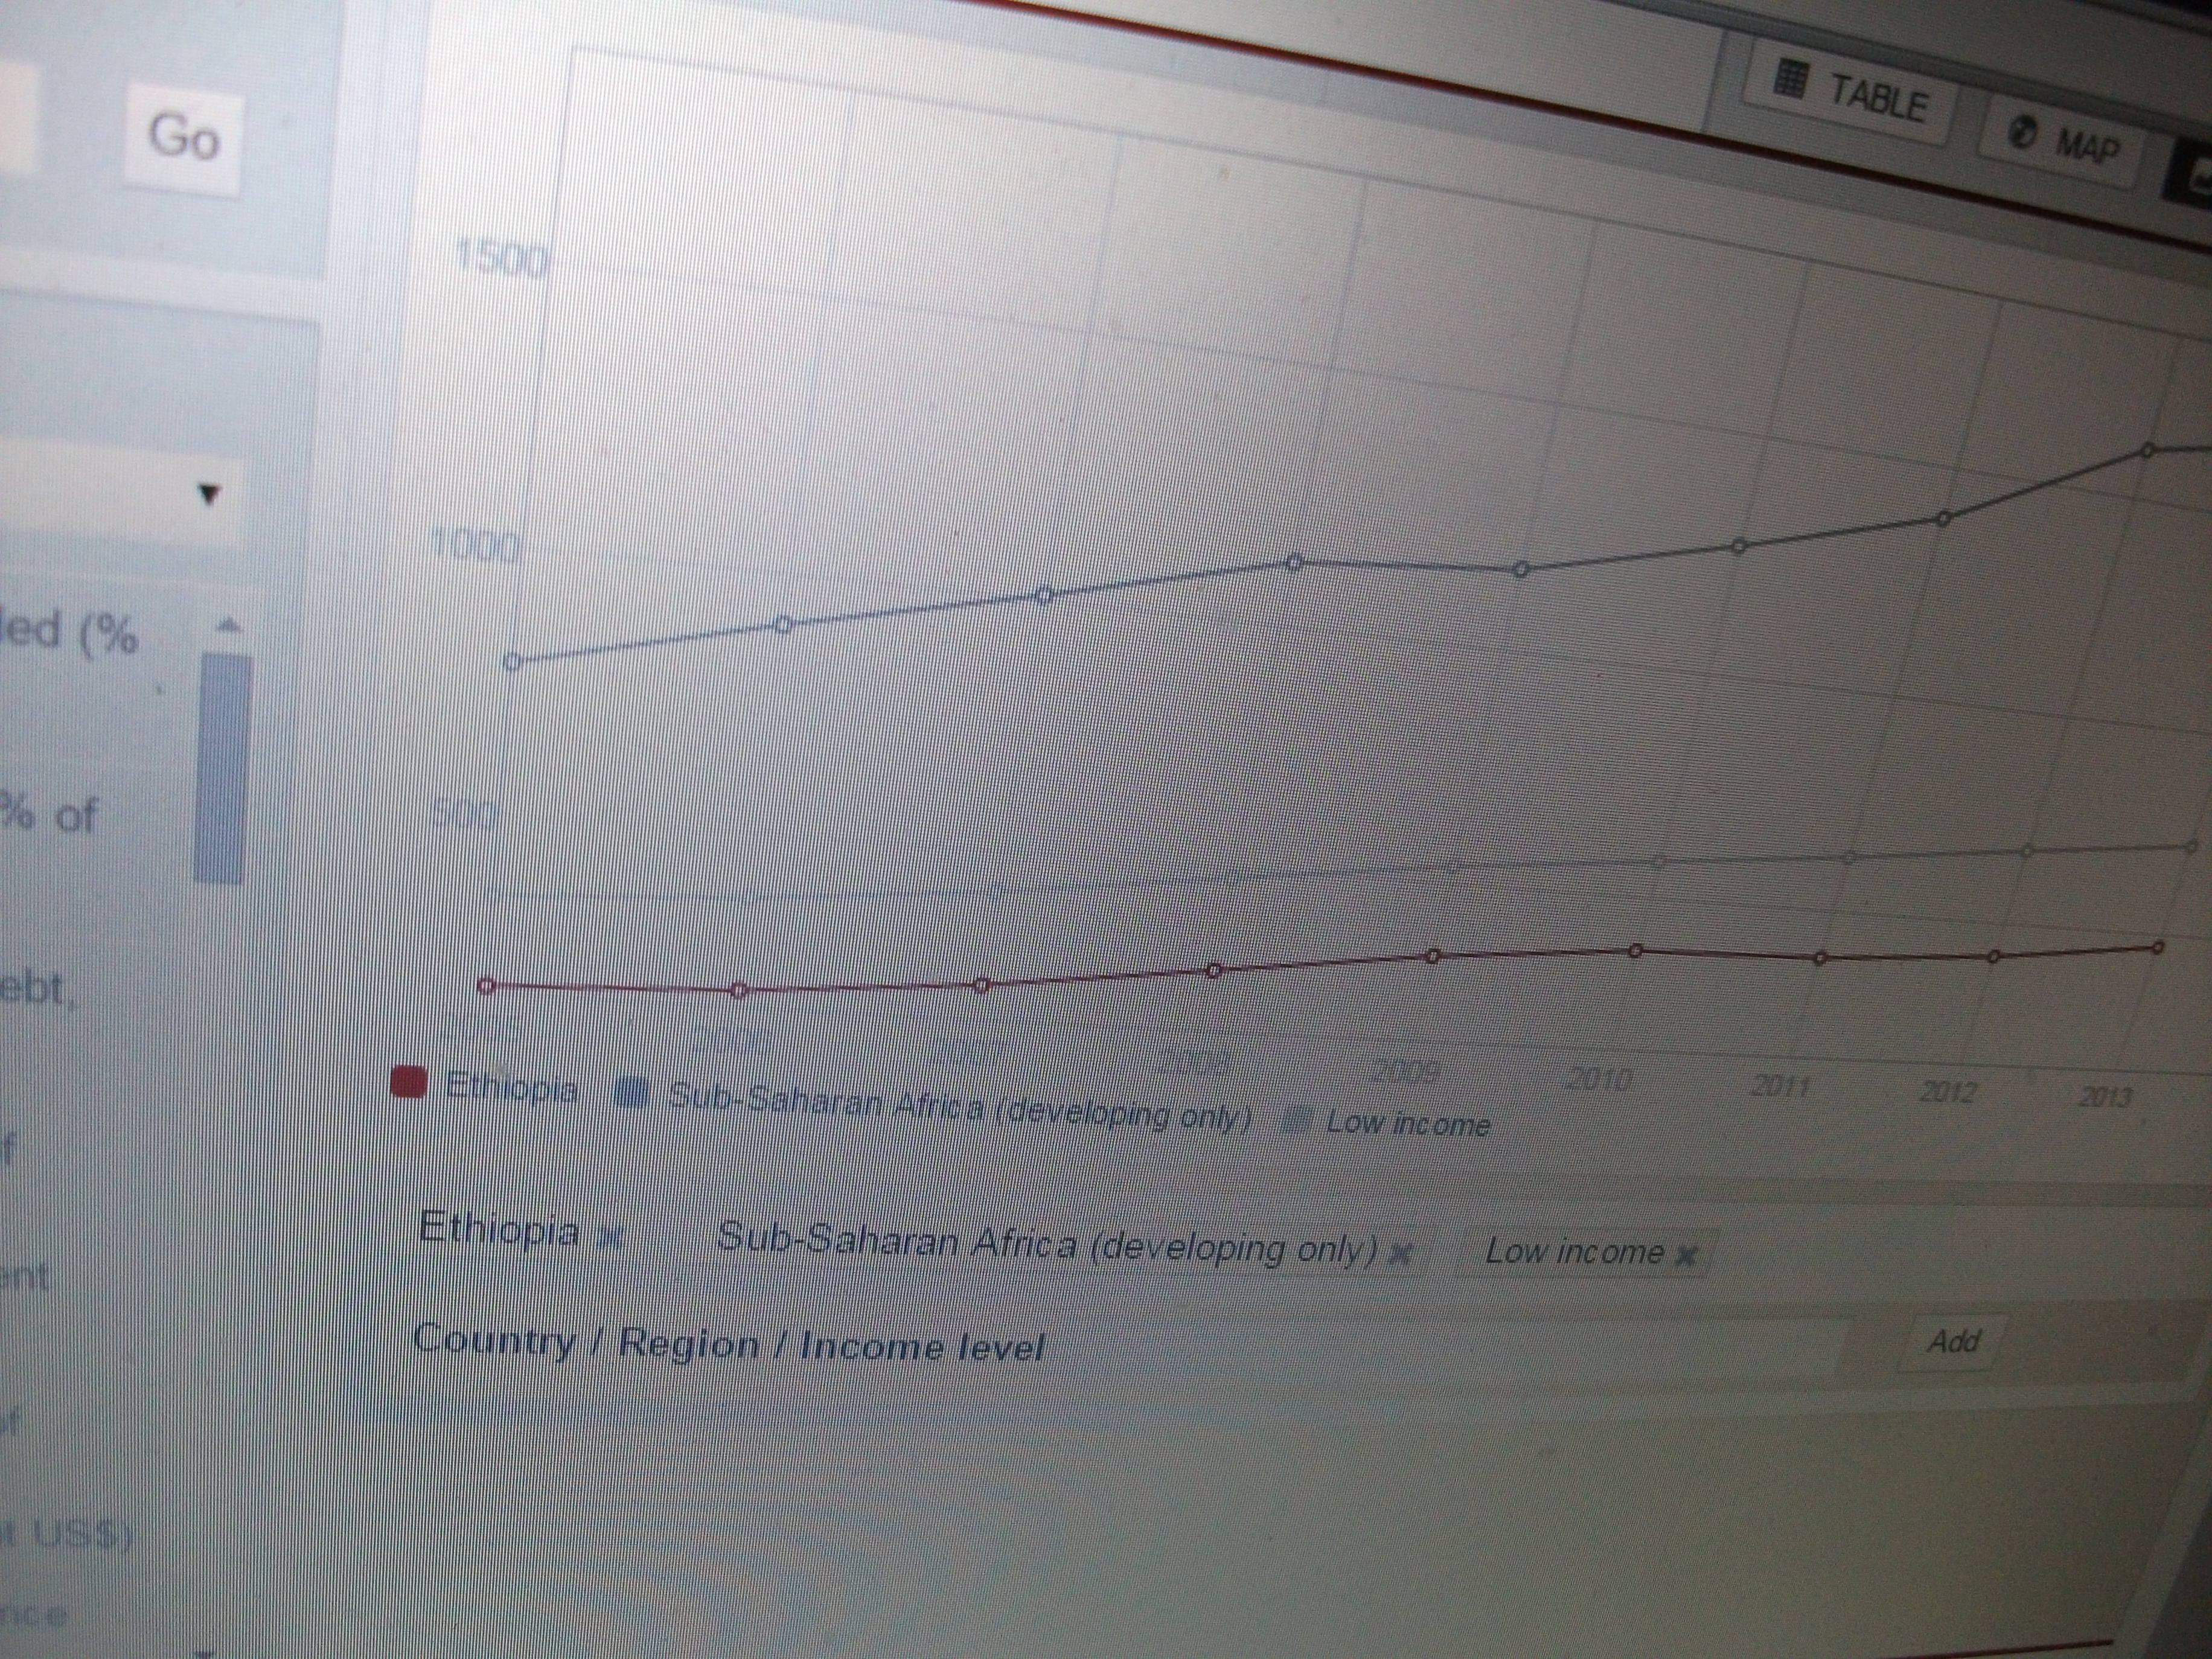
Ethiopia’s Per Capita Income trend, relative to Sub-Saharan Africa Average
Sub-Saharan African countries are the poorest regions of Africa and the world. The World Bank’s Per Head Income trend from 2005 shows that Ethiopia’s trend is by far below Sub-Saharan Africa average trends with constantly widening gap. With Per Capita Income of below $500 throughout the trends, World Bank data shows that Ethiopia’s trend has been below the averages of world’s low income countries. So, what is the point of Ethiopia’s ‘fastest growth’ hype?
GNI per capita, Atlas method (current US$) GNI per capita (formerly GNP per capita) is the gross national income, converted to U.S. dollars using the World Bank Atlas method, divided by the midyear population. GNI is the sum of value added by all resident producers plus any product taxes (less subsidies) not included in the valuation of output plus net receipts of primary income (compensation of employees and property income) from abroad. GNI, calculated in national currency, is usually converted to U.S. dollars at official exchange rates for comparisons across economies, although an alternative rate is used when the official exchange rate is judged to diverge by an exceptionally large margin from the rate actually applied in international transactions. To smooth fluctuations in prices and exchange rates, a special Atlas method of conversion is used by the World Bank. This applies a conversion factor that averages the exchange rate for a given year and the two preceding years, adjusted for differences in rates of inflation between the country, and through 2000, the G-5 countries (France, Germany, Japan, the United Kingdom, and the United States). From 2001, these countries include the Euro area, Japan, the United Kingdom, and the United States. -World Bank national accounts data, andOECDNational Accounts data files
Social Progress Index 2015: The lowest five countries in the world on Social Progress are Ethiopia, Niger, Afghanistan, Chad, Central African Republic. #Africa. #Oromia April 26, 2015
Posted by OromianEconomist in Africa, African Internet Censorship, Amnesty International's Report: Because I Am Oromo, Ethiopia & World Press Index 2014, Ethiopia the least competitive in the Global Competitiveness Index.Tags: Africa, African Studies, Ethiopia & The Global Innovation Index, Ethiopia and Internet censorship, Ethiopia and the social progress index, The Tyranny of Ethiopia
add a comment

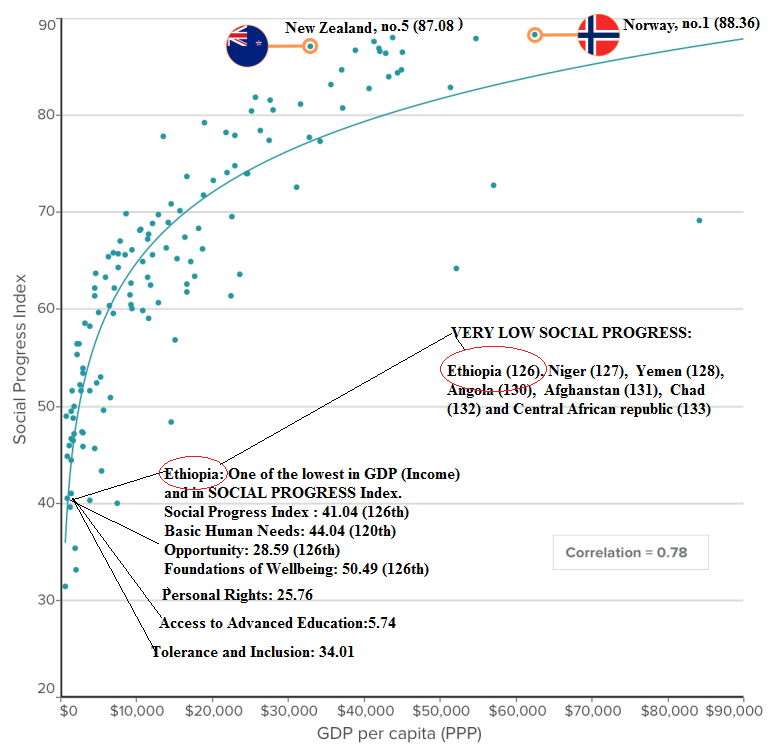
In measuring national progress, Ethiopia as in its GDP per head records one of the lowest in Social Progress Index 2015. Ethiopia ranks 126 of 133 countries.
‘The Social Progress Index offers a rich framework for measuring the multiple dimensions of social progress, benchmarking success, and catalyzing greater human wellbeing…. Economic growth alone is not enough. A society that fails to address basic human needs, equip citizens to improve their quality of life, protect the environment, and provide opportunity for many of its citizens is not succeeding. We must widen our understanding of the success of societies beyond economic outcomes. Inclusive growth requires achieving both economic and social progress.’
http://www.socialprogressimperative.org/data/spi#data_table/countries/spi/dim1,dim2,dim3
Click to access 2015%20SOCIAL%20PROGRESS%20INDEX_FINAL.pdf
COUNTRIES WITH VERY LOW SOCIAL PROGRESS ARE:
Ethiopia (126), Niger (127), Yemen (128), Angola (130), Afghanstan (131), Chad (132) and Central African republic (133).
Ethiopia’s outcome:
One of the lowest in GDP (Income) and in SOCIAL PROGRESS Index.
Social Progress Index : 41.04 (126th)
Basic Human Needs: 44.04 (120th)
Opportunity: 28.59 (126th)
Foundations of Wellbeing: 50.49 (126th)
- Ten countries in the world have been ranked as Very High Social Progress Countries as these countries generally have strong performance across all three dimensions. The average dimension scores for this tier are: Basic Human Needs is 94.77, Foundations of Wellbeing is 83.85, and Opportunity is 83.07.
- As with most high-income countries, the top 10 countries score lowest on Ecosystem Sustainability and Health and Wellness.
- Nearly all of the top 10 are relatively small countries, with only Canada having a population greater than 25 million.
- The top three countries in the world on Social Progress are Norway, Sweden, and Switzerland with closely grouped scores between 88.36 and 87.97.
- Canada is the only country among the G7 countries that has been ranked in top ten on SPI 2015
- Under the High Social Progress Countries tier, there are 21 countries. This group includes a number of the world’s leading economies in terms of GDP and population, including the remaining six members of the G7: the United Kingdom, Germany, Japan, the United States, France, and Italy. The average dimension scores for this tier are: Basic Human Needs is 90.86, Foundations of Wellbeing is 77.83, and Opportunity is 73.82
- The third tier of Upper Middle Social Progress Countries comprises of 25 countries. This group reveals that high GDP per capita does not guarantee social progress. Average scores for this tier are: Basic Human Needs is 80.66, Foundations of Wellbeing is 73.52, and Opportunity is 57.73.
- The fourth tier Lower Middle Social Progress Countries comprises of 42 countries. The average dimension scores for this tier are: Basic Human Needs is 72.34, Foundations of Wellbeing is 66.90, and Opportunity is 47.14
- Under the Low Social Progress Countries tier, there are 27 countries which include many Sub-Saharan African countries. The average dimension scores for this tier are: Basic Human Needs is 50.03, Foundations of Wellbeing is 58.01, and Opportunity is 38.35.
- Under the Very Low Social Progress Countries tier, there are 8 countries. The average dimension scores for this tier are: Basic Human Needs is 38.46, Foundations of Wellbeing is 48.55, and Opportunity is 26.05.
- The lowest five countries in the world on Social Progress are Ethiopia, Niger, Afghanistan, Chad, Central African Republic.
The Social Progress Index, first released in 2014 building on a beta version previewed in 2013, measures a comprehensive array of components of social and environmental performance and aggregates them into an overall framework. The Index was developed based on extensive discussions with stakeholders around the world about what has been missed when policymakers focus on GDP to the exclusion of social performance. Our work was influenced by the seminal contributions of Amartya Sen on social development, as well as by the recent call for action in the report “Mismeasuring Our Lives” by the Commission on the Measurement of Economic Performance and Social Progress.
The Social Progress Index incorporates four key design principles:
- Exclusively social and environmental indicators: our aim is to measure social progress directly, rather than utilize economic proxies. By excluding economic indicators, we can, for the first time, rigorously and systematically analyze the relationship between economic development (measured for example by GDP per capita) and social development. Prior efforts to move “beyond GDP” have comingled social and economic indicators, making it difficult to disentangle cause and effect.
- Outcomes not inputs: our aim is to measure the outcomes that matter to the lives of real people, not the inputs. For example, we want to measure a country’s health and wellness achieved, not how much effort is expended nor how much the country spends on healthcare.
- Holistic and relevant to all countries: our aim is to create a holistic measure of social progress that encompasses the many aspects of health of societies. Most previous efforts have focused on the poorest countries, for understandable reasons. But knowing what constitutes a healthy society for any country, including higher-income countries, is indispensable in charting a course for less-prosperous societies to get there.
- Actionable: the Index aims to be a practical tool that will help leaders and practitioners in government, business and civil society to implement policies and programs that will drive faster social progress. To achieve that goal, we measure outcomes in a granular way that focuses on specific areas that can be implemented directly. The Index is structured around 12 components and 52 distinct indicators. The framework allows us to not only provide an aggregate country score and ranking, but also to allow granular analyses of specific areas of strength and weakness. Transparency of measurement using a comprehensive framework allows change-makers to identify and act upon the most pressing issues in their societies.
These design principles are the foundation for our conceptual framework. We define social progress in a comprehensive and inclusive way. Social progress is the capacity of a society to meet the basic human needs of its citizens, establish the building blocks that allow citizens and communities to enhance and sustain the quality of their lives, and create the conditions for all individuals to reach their full potential.
This definition reflects an extensive and critical review and synthesis of both the academic and practitioner literature in a wide range of development topics. The Social Progress Index framework focuses on three distinct (though related) questions:
- Does a country provide for its people’s most essential needs?
- Are the building blocks in place for individuals and communities to enhance and sustain wellbeing?
- Is there opportunity for all individuals to reach their full potential?
These three questions define the three dimensions of Social Progress: Basic Human Needs, Foundations of Wellbeing, and Opportunity.
http://www.socialprogressimperative.org/data/spi/methodology
The Human Factor in Innovation:Ethiopia Ranks Very Low in 2014 Global Innovation Index July 20, 2014
Posted by OromianEconomist in Africa, Africa Rising, Ethiopia's Colonizing Structure and the Development Problems of People of Oromia, Afar, Ogaden, Sidama, Southern Ethiopia and the Omo Valley, Free development vs authoritarian model, The Global Innovation Index.Tags: African Studies, Development and Change, Economic and Social Freedom, Economic development, Economic growth, Ethiopia & The Global Innovation Index, Governance issues, Human Rights and Liberties
add a comment

![]()
![]()
![]()
Global Innovation Index (GII) 2014: This year, the theme of the report is the ‘Human Factor in Innovation’
The fundamental driver behind any innovation process is the human factor associated with it. We observe that some nations take the lead in innovation capability over others. A major factor for this disparity of innovation prowess is the quality of human capital linked to the innovation activities carried out in these nations. Other factors, such as technology and capital, also influence the innovation process; these directly correlate with the human factor. Hence nurturing human capital at all levels and in all sections of society can be crucial for developing the foundation for innovation.
Human-Centric Innovation: Inspired Talent Is the Engine of Innovation.
http://www.globalinnovationindex.org/content.aspx?page=gii-full-report-2014
Out of 143 countries listed in the Global Innovation Index report released in Sydney, Australia, 18th July 2014, Ethiopia is in the 126th position. The score is 25.4.
Among Ethiopia’s poorest performances are:
Innovation input sub-index (128)
Ecological sustainability (136)
Political stability (136)
Regulatory quality (134)
Ease of starting business (130)
Human Capital & research (137)
Education (136)
ICT access (133)
Logistics performance (133)
Online creativity (141)
http://www.globalinnovationindex.org/content.aspx?page=gii-full-report-2014#pdfopener
Switzerland, the United Kingdom and Sweden are the most innovative countries in the world – and Singapore is Asia’s most innovative economy. No African country made the first 39 spot in the ranking but Mauritius tops the list for African countries coming in at 40. Mauritius (40) and Seychelles (51) beat South Africa (53rd) to the chase in the African continent. The regional winner, Mauritius, has shown an impressive improvement of 13 places from 53rd in 2013. The following Africa countries are in the first 100 rankings: Tunisia (78), Morocco (84), Kenya (85), Uganda (91), Botswana (92), Ghana (96), Cabo Verde (97), Senegal (98) and Egypt (99).
Top 10 in the 2014 rankings:
1. Switzerland
2. United Kingdom
3. Sweden
4. Finland
5. Netherlands
6. USA
7. Singapore
8. Denmark
9. Luxembourg
10. Hong Kong (China)
According to the authors of the report: “These GII leaders have created well-linked innovation ecosystems, where investments in human capital combined with strong innovation infrastructures contribute to high levels of creativity.”
“In particular, the top 25 countries in the GII consistently score high in most indicators and have strengths in areas such as innovation infrastructure, including information and communication technologies; business sophistication such as knowledge workers, innovation linkages, and knowledge absorption; and innovation outputs such as creative goods and services and online creativity.”
11 of the bottom 20 countries are from Africa ( Ethiopia, Sudan, Burundi, Angola, Niger, Algeria, Zimbabwe, Swaziland, Benin, Guinea and Togo). These countries are making the 11 worst African countries.
The Global Innovation Index surveys 143 economies around the world, using 81 indicators – to gauge both their innovation capabilities and measurable results.
The annual rankings is published by Cornell University, INSEAD and the World Intellectual Property Organization.
To view the full list, click here

You must be logged in to post a comment.