

Ethiopia: የህወሓቶች ገበና ሲጋለጥ፤ እንደ ወራሪ ጦር የዘረፉት መሬት፣ እንደ ጠላት የትም የበተኑት ገንዘብ! (አፈትልኮ የወጣ ሰነድ) December 4, 2018
Posted by OromianEconomist in Uncategorized.Tags: Africa, African conditions, Corruption, CORRUPTION CRACKDOWN, Ethiopia, Ethiopia: TPLF's corruption empire, Meles Zenawi, Political & Economic Corruption, TPLF Corruption empire and Al Amoudi, TPLF tyranny, TPLF's crimes and political scandal, TPLF’s corruption
2 comments
የህወሓት ዘረፋና የመሬት ወረራ የተጀመረው ገና በትግል ላይ ሳለ ነው። በትግል ወቅት በቁጥጥሩ (ምርኮ) ስር የወደቁ ማናቸውንም ዓይነት ንብረትን የመውረስና ወደ ትግራይ ክልል ሰብስቦ የመውሰድ አባዜ ነበረው። ነገር ግን በዚህ መልኩ ተዘርፎ የሚወሰድ ሃብትና ንብረት ለህወሓቶች በቂ ወይም አጥጋቢ ሆኖ ባለመገኘቱ ከቁሳዊ ሃብት ይልቅ የከተማና ለም የሆኑ የእርሻ መሬቶችን መዝረፍ ጀመረ። የመሬትን ዘላቂ ጥቅምና አዋጭነት የተረዱት ህወሓቶች በ1984 መጀመያ አካባቢ በሰሜን ጎንደርና ወሎ ያሉ ለም የእርሻ መሬቶች ያሉበት ሁመራና ራያ በትግራይ ክልል ስር እንዲጠቃለል አደረጉ።
በመቀጠል በደርግ መንግስት ስር ይተዳደሩ የነበሩ የሜካናይዝድ የእርሻ መሬቶችን፣ ማሽኖችን፣ የባንክ ገንዘቦችን፣ በአጠቃላይ በወቅቱ በመንግስት ቁጥጥር የነበሩ ንብረቶችን “በኢንዳውመነት” ስም እንዲመዘገብ አደረጉ። በመቀጠል በተለያዩ የሀገሪቱ ክልሎች የሚገኙ የእርሻ መሬቶችን በኢንቨስትመንት ስም ተቆጣጠሩ። በዚህ መሰረት በጋምቤላንና አፋር ሙሉ በሙሉ በሚባል ደረጃ፣ አብዛኛው የቤንሻንጉል-ጉሙዝ የእርሻ እና የከተማ መሬቶች፣ በደቡብ ኦሞ የመንግስት እርሻ ቦታዎች፣ የሆቴል እና የመኖሪያ ቦታዎች፣ በመተማና ጎጃም እርሻ ልማቶች፣ እንዲሁም በአዲስ አበባ እና ዙሪያዋ የሚገኙ ጥሩ የኢንቨስትምት እና የማዕድን ቦታዎችን ያለ ተቀናቃኝ በበላይነት ተቆጣጥረዋል።
በዚህ ተግባር የተሰማሩት ሰዎች የአንድ መንደር ተወላጅ የሆኑ የህወሓት አባላት ናቸው። እነዚህ መንደርተኞች በድብቅ መሬት እንዲወስዱ የተደረገው በወቅቱ የሀገሪቱ ጠቅላይ ሚኒስተር በነበሩት በአቶ መለስ ዜናዊ ትዕዛዝ ነው። አሁንም እየዘረፉና ሃብቱን እያሸሹ ያሉት እነዚህ ሰዎች ናቸው። ይህን ለማረጋገጥ በኢትዮጵያ ልማት ባንክ አማካኝነት ከዋናው መስሪያ ቤት እስከ ቅርንጫፍ የተሠጡ ብድሮችን፣ እንዲሁም በብድር ማስታመሚያና ማገገሚያ ክፍሎች ያሉት ፕሮጀክቶች የእነማን እንደሆኑ በመመርመር እውነታውን መገንዘብ ይቻላል፡፡
Africa Rising Debt: Irresponsible spenders, corruption, the looting machine and illicit financial outflows May 23, 2018
Posted by OromianEconomist in Uncategorized.Tags: Africa, Africa and debt, Africa Debt, Africa Rising, Africa rising debt, Corruption, Development, Economics and Finance, Foreign Direct Investment, Illicit Financial outflows from Africa, Political & Economic Corruption
add a comment


A study of 39 African countries from 1970 to 2010 found that for every dollar borrowed, up to 63 cents left the continent within five years. The money is often siphoned out as private assets, suggests Léonce Ndikumana, one of the researchers, based at the University of Massachusetts, Amherst. Some banks seem more interested in juicy fees than good governance.
China’s involvement in Africa has made it harder to assess the situation. Countries such as Zambia and Congo-Brazzaville have taken out opaque loans from Chinese companies. Angola has borrowed more than $19bn from China since 2004, mostly secured against oil. Such loans often have built-in clauses to review repayments as prices fluctuate, says Deborah Brautigam of the China-Africa Research Initiative at Johns Hopkins University. But there is little precedent for restructuring Chinese loans. Nor is China a full member of the Paris Club, which co-ordinates the actions of creditors when things go wrong.
Though much of the money borrowed by states comes from foreign investors, some is provided by local banks. They find it easier to buy government bills than to assess the reliability of businesses or homebuyers. Moody’s, a ratings agency, estimates that African banks’ exposure to sovereign debt is often 150% of their equity. So a sovereign-debt crisis could fast turn into a banking one.
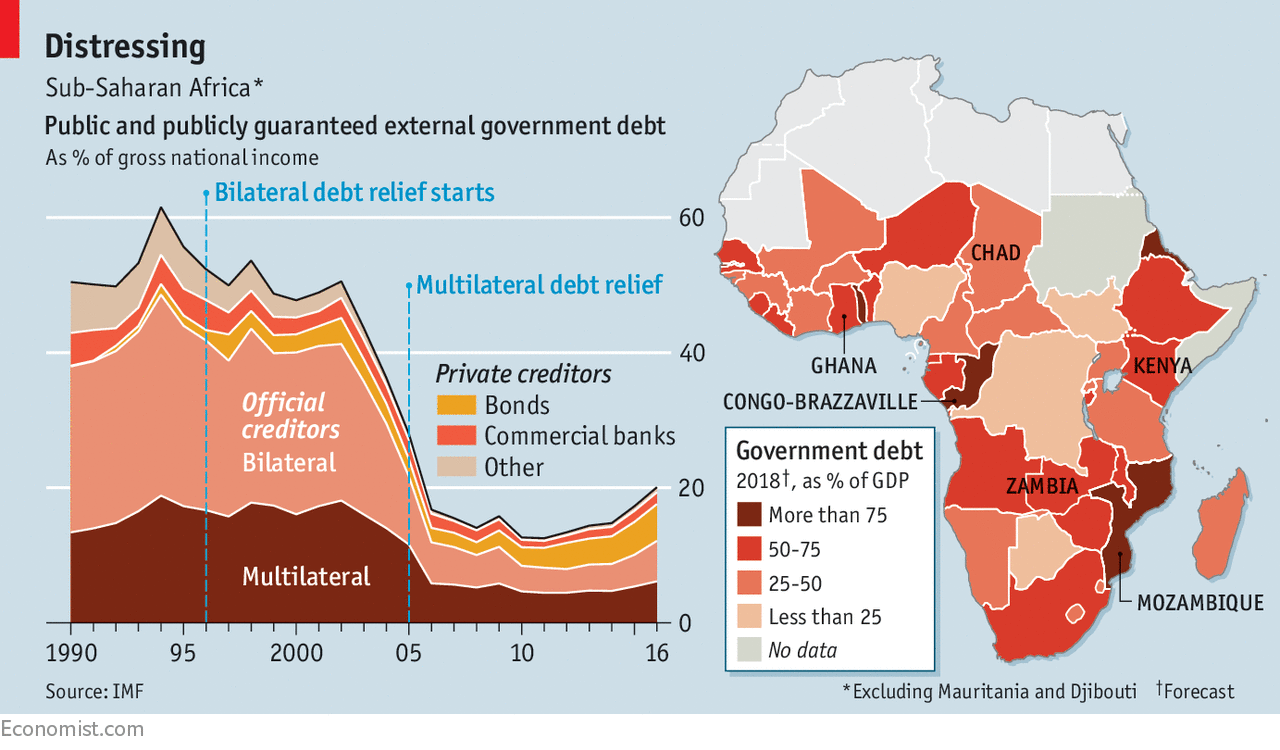
Africa in the red: Increasing debt in many African countries is a cause for worry
Unfortunately the keenest borrowers are also feckless spenders
“A FOOL’S bargain.” That is how Idriss Déby, Chad’s president, now describes the state oil company’s decision to borrow $1.4bn from Glencore, an Anglo-Swiss commodities trader, in 2014. The loan was to be repaid with future sales of crude, then trading above $100 a barrel. But two years later, as the price dived, debt payments were swallowing 85% of Chad’s dwindling oil revenue. For weeks schools have been closed and hospitals paralysed, as workers strike against austerity. On February 21st, after fractious talks, Chad and Glencore agreed to restructure the deal.
Chad’s woes recall an earlier era, when African economies groaned beneath unpayable debts. By the mid-1990s much of the continent was frozen out of the global financial system. The solution, reached in 2005, was for rich countries to forgive the debts that so-called “heavily indebted poor countries”, 30 of which were in Africa, owed to the World Bank, IMF and African Development Bank. With new loans and better policies, many of these countries turned their economies around. By 2012 the median debt level in sub-Saharan Africa (as defined by the IMF) fell to just 30% of GDP. Today the median debt level is over 50% of GDP. That is low by international standards, but interest rates are generally higher for African countries, which collect relatively little tax. Economic growth slowed in response to lower commodity prices. As a consequence, there is much less revenue to service debts. The pace of borrowing has picked up. The IMF reckons that five sub-Saharan African countries are already in “debt distress”, with nine more at high risk of joining them. Lending to Africa surged after the financial crisis, when interest rates in rich countries sank to historic lows. Fund managers chased the high yields of African government bonds and the profits from a commodities boom. The biggest lenders to Africa had long been Western governments. But since 2006, 16 African countries have sold their first dollar-denominated bonds to foreign investors. Interest rates in the rich world remain low, so several countries are scrambling back to the market this year. Senegal’s $2.2bn Eurobond was five times oversubscribed on March 6th. Borrowing makes sense for poor countries if it finances things like roads, schools and hospitals, which improve welfare and support economic growth. But the keenest borrowers in Africa are also feckless spenders. Take Ghana, which racked up debt as it ran an average annual budget deficit of 10% from 2012 to 2016. When a new government entered office last year, it found a $1.6bn “hole” in the budget. The new chairman of the state cocoa board found that a $1.8bn loan meant to fund cocoa production in 2017 was “all gone”.
Ghana got a three-year loan of $918m from the IMF in 2015, ensuring a degree of transparency. Commercial loans are easier to hide. In Mozambique, three state-owned companies borrowed $2bn in deals arranged by European banks. Most of this was done in secret. The proceeds were squandered on overpriced security gear and a bogus fleet of trawlers. An audit could not trace $500m. The once-buoyant economy sank and Mozambique defaulted on its debt last year.
Leveraged corruption
A study of 39 African countries from 1970 to 2010 found that for every dollar borrowed, up to 63 cents left the continent within five years. The money is often siphoned out as private assets, suggests Léonce Ndikumana, one of the researchers, based at the University of Massachusetts, Amherst. Some banks seem more interested in juicy fees than good governance. China’s involvement in Africa has made it harder to assess the situation. Countries such as Zambia and Congo-Brazzaville have taken out opaque loans from Chinese companies. Angola has borrowed more than $19bn from China since 2004, mostly secured against oil. Such loans often have built-in clauses to review repayments as prices fluctuate, says Deborah Brautigam of the China-Africa Research Initiative at Johns Hopkins University. But there is little precedent for restructuring Chinese loans. Nor is China a full member of the Paris Club, which co-ordinates the actions of creditors when things go wrong. Though much of the money borrowed by states comes from foreign investors, some is provided by local banks. They find it easier to buy government bills than to assess the reliability of businesses or homebuyers. Moody’s, a ratings agency, estimates that African banks’ exposure to sovereign debt is often 150% of their equity. So a sovereign-debt crisis could fast turn into a banking one. Disaster can still be averted in most African countries. Abebe Shimeles of the African Development Bank warns against sudden spending cuts, which would leave half-finished infrastructure projects to rust. Research from the IMF suggests that the least costly way to deal with fiscal imbalances in Africa is to raise meagre tax-to-GDP ratios, which have crept up by just a couple of percentage points this century. Other proposals aim to make lenders share more risk with borrowers by, for example, linking interest payments to growth or commodity prices. Some suggest changing laws in America and Britain, where most debt is issued, so that countries are not liable for loans agreed to by leaders acting without due authority. Organisations such as the IMF could be more robust, speaking out early when countries seem to be in a downward debt spiral. As it is, the costs of bad borrowing rarely fall on leaders or their lenders, which often makes politicians borrow (and steal) more. “It’s the common man that actually bears the brunt,” says Bernard Anaba of the Integrated Social Development Centre, a Ghanaian advocacy group. The people of Chad, now paying for Mr Déby’s foolish bargain, would surely agree.- For more click here for The Economist
Related (Oromian Economist Sources):
ECONOMIC COMMENTARY: THE DEBT CHALLENGE TO AFRICAN GROWTH, addisstandard
What are the main disadvantages of FDI in local developing economies? -Research gate
Corruption is a major contributor to Africa’s stunted development.-Afro Barometer
By corroding and weakening governance institutions and the democratic values of human rights, gender equality, justice, and the rule of law, it has hindered the continent’s progress toward peace and prosperity. A 2002 AU study estimated that Africa loses about $150 billion annually to corruption. Illicit financial outflows, particularly in the extractive industry, cost the continent about $50 billion per annum – far exceeding the official development assistance that African countries receive from Organization for Economic Cooperation and Development countries ($27.5 billion in 2016).
Africa’s Looting Machine: Warlords, Tycoons, Smugglers and the Systematic Theft of Africa’s Wealth review – ‘the raping of a continent’
Ethiopia (TPLF): Privatizing EFFORT: why & how? — Ethiopian Think Thank Group December 1, 2017
Posted by OromianEconomist in Uncategorized.Tags: EFFORT, Ethiopia, Political & Economic Corruption, TPLF, TPLF/EPRDF Ethiopian Regime is a Contra to a Developmental State
add a comment

Why privatize it? Because they now realize they are likely to loose political power and the new power holders whoever they might be will be tempted to nationalize the EFFORT conglomerate. So privatizing it before hand is a preemptive measure. They assume no new regime will be brave enough to nationalize private company. Note that although privatized the company will continue to fulfill its founding objective…allow Tigrean elites dominate the economy. They new ‘private’ owners will be party leaders, relatives and loyalists who will own it on behalf of the oligarchy.
TPLF leaders are planning to transfer EFFORT to their individual ownership in the name of make it IPO, document reveals. Remember they claim EFFORT was established by money they got from Western donors due to the 1980s drought and meant to rehabilitate war affected people of Tigray. In reality most of the seed money was […]
via Privatizing EFFORT: why & how? — Ethiopian Think Thank Group
TPLF Ethiopia’s Regime Money Laundering Activities & Its Networks August 26, 2017
Posted by OromianEconomist in Illicit financial outflows from Ethiopia, Uncategorized.Tags: Abdi ILey, Africa, Corruption, Ethiopia, Illicit Financial Flows from Ethiopia, Illicit Financial outflows from Africa, Money laundering, Political & Economic Corruption, Political corruption, SESEDA, Somali-Ethiopian Social and Economic Development Association (SESEDA), TPLF
4 comments
$500,000.00 | TPLF and Money Laundering: The Key Questions to Ask | Must Watch
Ethiopia- Oromia : police apprehended a man traveling with US$541,671
Somali-Ethiopian Social and Economic Development Association (SESEDA)
SESEDA is TPLF’s organization that collects aid money for criminal activities.
Ogaden: Abdi Iley declares secession from Ethiopia if his thief agent won’t get released
Is usaid helping the people of Ethiopia/Oromia or working with the TPLF mafia regime??
There is gross Human rights abuse in Ethiopia and the TPLF mafia regime is getting away with torture and killing!!


ANALYSIS By J. Bonsa
A substantial sum of money has been illegally flowing out of Ethiopia during the last decade. What is even more worrying is not just that the levels of out flows are high but also the sizes of illicit capital outflows have been rising at alarming rates. This rather unique pattern has attracted the attention of the general public as well as those of bilateral and multilateral donor agencies.
I will also attempt to put some flesh on the bones of facts presented in the GFI database. I will do so by shedding some light on the political economy context of the illicit capital outflow (IFFs) from Ethiopia.
Stolen money trails
The natural starting point is to get a sense of magnitude on the levels and trends. The GFI data is summarized and plotted in Fig. 1. For the time being we focus on the total flows, that is the heights of each bar denoting sizes of annual illicit money outflows. The sum of the blue and red colors gives total amount of money illegally moved aboard from Ethiopia during that year. This ranged from USD $0.4 billion in 2004 to USD $5.6 billion in 2010.
The average annual outflow was $2.6 billion during 2004 and 2013. This is a sizeable sum of money by any standard. For instance, according to estimates reported by the World Bank, the amount of official development assistant (ODA) Ethiopia received in 2010 was $4 billion but total amount of IFFs during that year was $5.6 billion.
This means in 2010 alone Ethiopia’s IFFs exceeded the ODA it received that year by $1.6 billion. In other words, Ethiopia’s IFFs amounted to diverting the entire aid money of 2010 to foreign banks and then still transfer abroad an additional sum of money.
During the entire period (2004 to 2013) the total amount of money that Ethiopia lost due to IFF was $26 billion. This amounts to stealing nearly $300 per citizen. Alternatively, the size of stolen money was about 11 times the total the amount of emergency aid being sought from donors in the current year to buy cereals from abroad and feed the drought victims.
Potential culprits
One may wonder – who are the culprits responsible for Ethiopia’seconomic fraud at such massive scale? The GFI categorizes possible perpetrators into three groups: (a) financial institutions; (b) complicit business counterparts, mainly importers and exporters; and (c) government officials.
In the Ethiopian case, it is reasonable to exclude financial institutions because there is no foreign bank operating in Ethiopia, and the domestic private banks are extremely tightly controlled. Ethiopia’s most influential banks, the Commercial Bank of Ethiopia (CBE) and the National Bank of Ethiopia (NBE), are owned and run by the government. Therefore, in the context of Ethiopia it is safe to include (a) under (c).
That is to say Ethiopia’s IFF can only be undertaken by importers, exporters or government officials. One would hasten to add that there is a huge extent of overlaps between government officials and big businesses in Ethiopia, since big businesses are highly interconnected with the government and/or they are directly or indirectly owned and run by government officials.
Money diversion channels
Now we can shift our attention back to fig. 1 and consider the breakdowns of the IFFs, the individual component denoted by the blue and red sections in each bar. The GFI applies a methodological framework that accounts for two types of illegal movements of money from one country to another.
The first one is export or import trade misinvoicing. This is measured by using a methodology called Gross Excluding Reversals (GER). This simply mirrors exports by one country with imports of another country and vice versa. For instance, items of imports recorded by Ethiopia should agree with records of exporters to Ethiopia in all aspects – value, quantity and quality.
The second one is various leakages in the balance of payments, measured by using the “hot money narrow” (HMN) approach.The latter one is often referred to as “net errors and omissions” in the balance of payment jargon. For instance, if a donor agency or country recorded $1 million grants to Ethiopia but this does not appear in the records by the authorities in Ethiopia, then the GFI records this as a leakage from Ethiopia’s balance of payment.
It is clear from Fig. 1 that the bulk of illicit money transfer from Ethiopia has taken place using trade misinvoicing, denoted by the blue component of the bar. In 2004, trade misinvoicing constituted only 14% of the total IFFs. In 2013, however, this proportion has grown to 100%, the entire IFFs began to be accounted for more and more by trade misinvoicing. For the entire period under discussion, $19.7 billion (or 76% of the total IFFs) was conducted through trade misinvoicing. The year 2010 is an exception – diversion of “hot money” dominated in that year; it constituted 55% of the total IFFs.
False invoices
Trade misinvoicing can take place in one of the following four ways: over invoicing exports, under invoicing exports, over invoicing imports and under invoicing imports. In Ethiopia’s case, the GFI report indicated import over-invoicing is by far the most important method of transferring money abroad. During the period under analysis, about $19.7 billion was transferred abroad through import over-invoicing.
It is critical to understand how import misinvoicing hurts the Ethiopian economy. This is important in the context of huge public construction projects with substantially large components of imports of machinery and other equipment. For instance, an acquisition of a set of machinery whose real value is $1 million is recorded with inflated invoice of $1.5 million.
The importer allocates project budget at the inflated import value, pays the real value to the supplier and then siphons-off the difference (in this case $0.5 million) and deposits it in a foreign bank account. The real damage to the economy happens in terms of inflated capital expenditure. Perhaps the opportunity large capital projects provide for corrupt officials could be the ulterior motive for the uncontrollable urge to attach such a high priority to large capital projects in economic development strategies.
However, it should be noted that public capital projects are often financed through commercial loans that should be paid back with cumulative interests in years to come. The economic return to capital project would partly depend on the cost consideration at project implementation stage.
The GFI also finds some export trade misinvoicing in Ethiopia’s foreign trade, over-invoicing by $6.5 billion as well as $3 million under-invoicing. In trade based money laundering, the most common types of misinvoicing are import over-invoicing and export under-invoicing. As noted above, the case of import invoicing has no complications – so much over invoicing has taken place and it explains the bulk of trade based money laundering in Ethiopia. However, the case of export over-invoicing is uncommon.
Export over-invoicing do happen although they are rare, e.g. China’s trade with Hong-Kong. Export over-invoicing is required when there is a need to plough back money from abroad and report it as inflated foreign direct investment. This is likely the case with Ethiopia where the authorities have been desperate to report higher foreign investments particularly in the first half of the period under analysis.
Ethiopia’s capital flights dwarfs rest of developing countries
It would prove useful to know how bad Ethiopia’s IFFs is relative to other countries. Fig. 2 below compares Ethiopia with its neighbors, the rest of Sub-Saharan Africa (SSA) as well as the average of developing countries (DCs). The comparison was done by expressing total illicit money outflowas percentage of GDP. The years are grouped into three intervals. For reasons discussed further below, it would prove useful to contrast pre- and post-2005. Accordingly, I have isolated 2004 and then divided the remaining years into two equal intervals.
This revealed astonishing patterns of illicit money outflow from Ethiopia which starkly contrasted with those for other countries. First, throughout the years Ethiopia’s records considerably exceeded those for its two immediate neighbors, Kenya and Tanzania. Second, a comparison of 2004 across the countries shows that Ethiopia’s illicit money outflow was way below the Uganda, SSA, and the DCs averages.
Third, the situation changed dramatically from 2005 onwards. Ethiopia outstripped Uganda, and then closed the gap with the SSA average. Fourth, Ethiopia’s average annual money outflows between 2010 and 2013 reached 11% of the country’s GDP, considerably exceeding the corresponding figures for the other countries – SSA (5%), DCs (4%), Uganda and Tanzania (2%) and Kenya (0.013%). Fifth, it is important to note that illicit money transfers abroad constituted smaller and smaller percentages of GDP for most countries over the years, implying substantial improvements in transparency in their economic management. The situation in Ethiopia sharply contrasts with this reality – illicit money outflow becoming a larger and larger percentage of Ethiopia’s GDP. This indicates transparency in Ethiopia’s economic management has gone from bad to worse over the years.
The type of corruption that really hampers Nigeria’s economy August 25, 2015
Posted by OromianEconomist in Corruption, Corruption in Africa, Uncategorized.Tags: Africa, African Studies, Ethiopia: TPLF's corruption empire, Political & Economic Corruption, Political and Economic Corruption in Africa
add a comment

Economic Freedom Index 2015: Ethiopia is ranked 37th out of 46 countries in the Sub-Saharan Africa region, and its overall score continues to be below the regional average.Ethiopia’s economic freedom score is 51.5 July 27, 2015
Posted by OromianEconomist in Corruption, Free development vs authoritarian model.Tags: Africa, Ethiopia, Ethiopia & The Global Innovation Index, Ethiopia and the social progress index, Ethiopia: TPLF's corruption empire, Political & Economic Corruption
1 comment so far
‘State institutions are dominated by ruling EPRDF officials who reportedly receive preferential access to credit, land leases, and jobs. Under the government’s “villagization” program, hundreds of thousands of indigenous people have been forcibly relocated to new villages with inadequate infrastructure so that the state can lease their lands to commercial agricultural foreign investors.’
Ethiopia’s economic freedom score is 51.5, making its economy the 149th freest in the 2015 Index. Ethiopia is ranked 37th out of 46 countries in the Sub-Saharan Africa region, and its overall score continues to be below the regional average.
With a large domestic market and promising economic prospects, Ethiopia has the potential to become a regional economic powerhouse, but persistent state intervention in the relatively closed economy has suppressed the growth of economic freedom over the past five years.
Overall, the institutional basis of economic freedom in Ethiopia is still weak. A nominally independent judiciary continues to follow government policy advice, and corruption remains endemic. The government has made significant investments in major development projects, including the Grand Renaissance Dam, but restricts foreign investment in major industries and keeps important sectors of the economy closed to global trade and investment.
Ethiopia has had 10 years of steady economic growth, but not enough to reduce poverty. Its per capita income remains among the world’s lowest. Ethiopia is a leading coffee producer. Its economy is largely based on agriculture and is vulnerable to droughts and external shocks.
RULE OF LAW
Corruption is a significant problem in Ethiopia. State institutions are dominated by ruling EPRDF officials who reportedly receive preferential access to credit, land leases, and jobs. Under the government’s “villagization” program, hundreds of thousands of indigenous people have been forcibly relocated to new villages with inadequate infrastructure so that the state can lease their lands to commercial agricultural foreign investors.
LIMITED GOVERNMENT
Ethiopia’s top individual income tax rate is 35 percent, and its top corporate tax rate remains at 30 percent. Other taxes include a value-added tax and a tax on capital gains. The overall tax burden equals 11.6 percent of the domestic economy, and government spending accounts for 16.9 percent of gross domestic product. Public debt equals 22 percent of annual production.
REGULATORY EFFICIENCY
Inconsistent enforcement of regulations often impedes business activity and undermines economic development. The minimum capital requirement for launching a business is higher than the level of average annual income. Much of the labor force is employed in the informal sector. Monetary stability has been weak, and subsidies for the government’s state-led development model are hindering private-sector growth.
OPEN MARKETS
Ethiopia has a 10.3 percent average tariff rate. It is not a member of the WTO, and government procurement processes can favor domestic companies. Foreign investment is heavily regulated. There is no constitutional right to own land. The small financial sector continues to evolve and is largely dominated by banks. The capital market remains underdeveloped, and there is no stock exchange.
Read more At:-
http://www.heritage.org/index/country/ethiopia
ETHIOPIA: IS TPLF GOVERNING OR EXPANDING IT’S CORRUPTIONS EMPIRE?
Africa:Why are we so poor? Yet we are so rich? August 12, 2014
Posted by OromianEconomist in Africa, Africa and debt, Africa Rising, African Poor, Aid to Africa, Ethiopia's Colonizing Structure and the Development Problems of People of Oromia, Afar, Ogaden, Sidama, Southern Ethiopia and the Omo Valley, Free development vs authoritarian model, US-Africa Summit, Youth Unemployment.Tags: Africa, African Studies, Development and Change, Human rights violations, Land grabbing, Political & Economic Corruption
add a comment

Africa’s poverty persists in the midst of a wealth of natural resources, estimated by the United Nations Economic Commission on Africa as including 12 percent of the world’s oil reserves, 42 percent of its gold, 80 to 90 percent of chromium and platinum group metals, and 60 percent of arable land in addition to vast timber resources.
If these were idle, unexploited resources, it would be one thing.However, the reality is that they are increasingly being exploited: investment and trade in Africa’s resources sector is on the rise, largely accounting for the sustained GDP growth rates witnessed over the last decade. The Economist magazine has reported increased foreign direct investment into Africa, rising from U.S. $15 billion in 2002, to $37 billion in 2006 to $46 billion in 2012.
While trade with China alone went up from $11 billion in 2003, to $166 billion in 2012, very little can be pointed to in commensurate changes in human development and fundamental economic transformation. It is multi-national corporations and a few local elites which are benefiting disproportionately from the reported growth – exacerbating inequality and further reinforcing the characteristic “enclave economy” structural defect of most African economies.
The disparity between sustained GDP growth rates and Africa’s seemingly obstinate and perverse state of underdevelopment, extreme poverty and deepening inequality brings to the fore issues of inclusivity and responsible governance of domestic resources. The question that is being asked by many – especially Africa’s young people who have assumed the agenda for economic transformation as a generational mandate – is this: Why are we so poor? Yet we are so rich?
Read more @http://allafrica.com/stories/201408120664.html

You must be logged in to post a comment.