Double-digit propaganda, Ethiopia’s top 10 wealthiest people, and Ethiopia’s 87 million poor June 4, 2017
Posted by OromianEconomist in Uncategorized.Tags: Africa, Ethiopia, Ethiopia and poverty, Ethiopia: The 2016 Multidimensional Poverty Index, Famine and the “Ethiopia rising” meme, Multidimensional Poverty Index, Multidimensional Poverty Index: Ethiopia has the second highest percentage of people who are MPI poor in the world: op Ten Poorest Countries in The World (All in #Africa) – MPI 2015 Ranking, poverty, Poverty and TPLF tyranny in Ethiopia
1 comment so far
You will see in the news, and officials of the oppressive Ethiopian government will smile convincingly when they tell you, that Ethiopia is thriving with a “double-digit” economic growth.Yet many experts and scholars will explain to you why this is triple-digit nonsense and quadruple-digit propaganda.
Read more from the original source: Double-digit propaganda, Ethiopia’s top 10 wealthiest people, and Ethiopia’s 87 million poor
World Atlas: Countries With The Lowest Income In The World April 16, 2017
Posted by OromianEconomist in Economics.Tags: Africa, Africa is still struggling with poverty, Burundi, Countriies with very low income, Development, DR Congo, economics, Ethiopia, Ethiopia: The 2016 Multidimensional Poverty Index, Least developing countries, Liberia, Malawi, poverty
add a comment
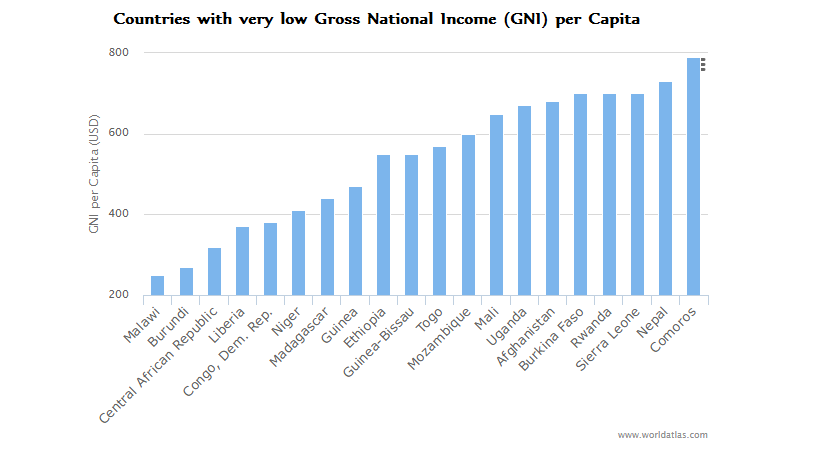
Countries With Very Low per Capita GNIs: Malwai, Burundi, Central African Republic, Liberia, the Democratic Republic of Congo, Niger, Gambia, Madagascar, Guinea, Guinea-Bissau, and Ethiopia are all struggling with extreme poverty. Within them, GNI per capita rates vary from 250 to 550 international dollars. This often becomes even more concerning when considering that income disparities often leave the general population in an even poorer state the already bad numbers would suggest. Collectively, these countries need strong economic reforms to begin to fight poverty and increase the welfare of their citizens and secure stronger standings on the global economic scene.
Countries With The Lowest Income In The World
These following countries have the smallest Gross National Income (GNI) per capita worldwide.

Malawi’s Economic Issues
According to World Bank data, the country with the smallest GNI per capita is Malawi, with 250 international dollars of income per person. Although the country enjoys a democratic and stable government, the economy continues to operate within a poor fiscal environment, characterized by the country’s high debt levels. The social environment is characterized by a proliferation of inequality and poverty, with over a half of the population being considered as poor, and one-quarter of it living in extreme poverty. The low agricultural productivity is one of the main obstacles in reducing the poverty, further worsened by increasing erratic weather patterns.
Post-Conflict Poverty in Burundi
Burundi, with a GNI of 270 international dollars, is the country with the second smallest GNI per capita. Even if the country is in the process of transitioning from a post-conflict economy to a stable, peacetime economy, poverty remains at troublingly high levels. The country is focusing on developing its basic social services, modernizing the public finance sector, and upgrading institutions and infrastructure across the board. Though it possesses a modernized industrial establishment, it above all relies on the agricultural sector, energy production, and mining for the majority of its revenues. The growing economy will increasingly offer more employment opportunities, and hopefully improvements in the standard of living will be quick to follow.
Underdeveloped Resources in the Central African Republic
The Central African Republic has the third-smallest GNI per capita value (330 international dollars). While it’s true that the country has recently been devastated by a political crisis, the Central African Republic was among the countries with the highest poverty rates well before the recent tumultuous events. The country possesses abundant natural resources but, unfortunately, they are generally very underdeveloped. Subsistence agriculture represents almost one-third of the gross domestic product. Exports of diamonds and wood, while relatively significant domestically, have clearly not been enough to raise the economy to the level of a major global power.
Liberia’s Epidemic
Liberia’s economy was gravely affected by the Ebola crisis that swept Africa for much of the new millennium. Indeed, the outbreak essentially reversed many of the important gains the country has made in the fights against political and economic insecurity and poverty. The quarantines implemented due to the Ebola epidemic affected the production and exports of rubber as workers were restricted in their daily travels, and contamination from African goods became a global concern. The weak business environment constrains the growth of manufacturing industries, and most of the important sectors suffered production disruptions due to the epidemic. The economy of Liberia definitely needs effective implementation of an economic recovery plan
Other Countries With Low per Capita GNIs
Besides these countries, the Democratic Republic of Congo, Niger, Gambia, Madagascar, Guinea, Guinea-Bissau, and Ethiopia are all struggling with extreme poverty as well. Within them, GNI per capita rates vary from 380 to 550 international dollars. This often becomes even more concerning when considering that income disparities often leave the general population in an even poorer state the already bad numbers would suggest. Collectively, these countries need strong economic reforms to begin to fight poverty and increase the welfare of their citizens and secure stronger standings on the global economic scene.
Gross National Income (GNI) per Capita
| Rank | Country | GNI Per Capita (USD) |
|---|---|---|
| 1 | Malawi | $250 |
| 2 | Burundi | $270 |
| 3 | Central African Republic | $320 |
| 4 | Liberia | $370 |
| 5 | Congo, Dem. Rep. | $380 |
| 6 | Niger | $410 |
| 7 | Madagascar | $440 |
| 8 | Guinea | $470 |
| 9 | Ethiopia | $550 |
| 10 | Guinea-Bissau | $550 |
| 11 | Togo | $570 |
| 12 | Mozambique | $600 |
| 13 | Mali | $650 |
| 14 | Uganda | $670 |
| 15 | Afghanistan | $680 |
| 16 | Burkina Faso | $700 |
| 17 | Rwanda | $700 |
| 18 | Sierra Leone | $700 |
| 19 | Nepal | $730 |
| 20 | Comoros | $790 |
| 21 | Haiti | $820 |
| 22 | Zimbabwe | $840 |
| 23 | Benin | $890 |
| 24 | Tanzania | $920 |
| 25 | South Sudan | $970 |
Oxfam: Africa: Ethiopia: The 2016 Multidimensional Poverty Index June 4, 2016
Posted by OromianEconomist in Uncategorized.Tags: Africa, Ethiopia: The 2016 Multidimensional Poverty Index, Incidence of Poverty in Oromia and Ethiopia, Multidimensional Poverty Index, Multidimensional Poverty Index: Ethiopia has the second highest percentage of people who are MPI poor in the world: op Ten Poorest Countries in The World (All in #Africa) – MPI 2015 Ranking, poverty
add a comment

In terms of MPI measurement, Ethiopia’s 87.3% of the population are identified as MPI poor, by far higher than Africa’s average (54%) and East Africa’s average (70%).
MPI Country Briefing 2016, Ethiopia
The 2016 Multi-Dimensional Poverty Index was published on 3rd June 2016. It now covers 102 countries in total, including 75 per cent of the world’s population, or 5.2 billion people. Of this proportion, 30 per cent of people (1.6 billion) are identified as multidimensionally poor.
The Global MPI has 3 dimensions and 10 indicators (for details see here and the graphic, right). A person is identified as multidimensionally poor (or ‘MPI poor’) if they are deprived in at least one third of the dimensions. The MPI is calculated by multiplying the incidence of poverty (the percentage of people identified as MPI poor) by the average intensity of poverty across the poor. So it reflects both the share of people in poverty and the degree to which they are deprived.

The MPI increasingly digs down below national level, giving separate results for 962 sub-national regions, which range from having 0% to 100% of people poor (see African map, below). It is also disaggregated by rural-urban areas for nearly all countries as well as by age.
Headlines from the MPI 2016:
- There are 50% more MPI poor people in the countries analysed than there are income poor people using the $1.90/day poverty line.
- Almost one third of MPI poor people live in Sub-Saharan Africa (32.%); 53% in South Asia, and 9% in East Asia.
- As with income poverty, three quarters of MPI poor people live in Middle Income Countries.
This year’s MPI focuses on Africa:
- In the 46 African countries analysed, 544 million people (54% of total population) endure multidimensional poverty, compared to 388 million poor people according to the $1.90/day measures.
- The differences between the proportion of $1.90 and MPI poor people are greatest in East and West Africa. By the $1.90/day poverty line, 48% in West Africa and 33% in East Africa are poor, whereas by the MPI, 70% of people in East Africa are MPI poor and 59% in West Africa. The MPI thus reveals a hidden face of poverty that may be overlooked if we consider only its income aspects.

- Among 35 African countries where changes to poverty over time were analysed, 30 of them have reduced poverty significantly. Rwanda was the standout star, but every MPI indicator was significantly reduced in Burkina Faso, Comoros, Gabon and Mozambique as well.
- Disaggregated MPI results are available for 475 sub-national regions in 41 African countries. The poorest region continues to be Salamat in Chad, followed by Est in Burkina Faso and Hadjer Iamis in Chad. The region with the highest percentage of MPI poor people is Warap, in South Sudan, where 99% of its inhabitants are considered multidimensionally poor. The least poor sub-national regions include Grand Casablanca in Morocco and New Valley in Egypt, with less than 1% of the population living in multidimensional poverty.
- The MPI registered impressive reductions in some unexpected places. 19 sub-national regions – regional ‘runaway’ successes – have reduced poverty even faster than Rwanda. The fastest MPI reduction was found in Likouala in the Republic of the Congo.
- The Sahel and Sudanian Savanna Belt contains most of the world’s poorest sub-regions, showing the interaction between poverty and harsh environmental conditions.
- Poverty looks very different in different parts of the continent. While in East Africa deprivations related to living standards contribute most to poverty, in West Africa child mortality and education are the biggest problems.
- The deprivations affecting the highest share of MPI poor people in Africa are cooking fuel, electricity and sanitation.
- The number of poor people went down in only 12 countries. In 18 countries, although the incidence of MPI fell, population growth led to an overall rise in the number of poor people.
See here for my post on the MPI 2014. I’d be interested in your reflections on what MPI adds to the usual $ per day metrics, in terms of our understanding of development.
http://www.dataforall.org/dashboard/ophi/index.php/mpi/country_briefings

You must be logged in to post a comment.