ETHIOPIA MAKES AMONG THE WORST 11 COUNTRIES IN 2017 WORLD HEALTH SYSTEM RANKINGS, WORLD HEALTH ORGANIZATION December 19, 2017
Posted by OromianEconomist in Uncategorized.Tags: #NoTedros4WHO, Ethiopia, Health, Health care is the fundamental human rights and not a tool of war, Health crisis in Ethiopia, Multidimensional Poverty Index: Ethiopia has the second highest percentage of people who are MPI poor in the world: op Ten Poorest Countries in The World (All in #Africa) – MPI 2015 Ranking, WHO, WORLD HEALTH SYSTEM RANKINGS
add a comment


180 Ethiopia
181 Angola
182 Zambia
183 Lesotho
184 Mozambique
185 Malawi
186 Liberia
187 Nigeria
188 Democratic Republic of the Congo
189 Central African Republic
190 Myanmar
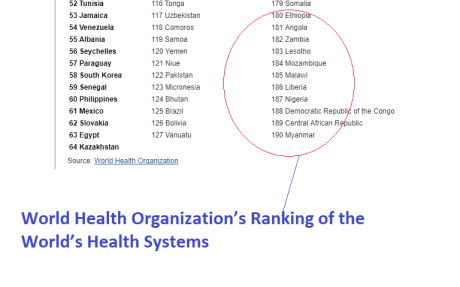
World’s excellence in health care delivery:–
1 France
2 Italy
3 San Marino
4 Andorra
5 Malta
6 Singapore
7 Spain
8 Oman
9 Austria
10 Japan
11 Norway
Double-digit propaganda, Ethiopia’s top 10 wealthiest people, and Ethiopia’s 87 million poor June 4, 2017
Posted by OromianEconomist in Uncategorized.Tags: Africa, Ethiopia, Ethiopia and poverty, Ethiopia: The 2016 Multidimensional Poverty Index, Famine and the “Ethiopia rising” meme, Multidimensional Poverty Index, Multidimensional Poverty Index: Ethiopia has the second highest percentage of people who are MPI poor in the world: op Ten Poorest Countries in The World (All in #Africa) – MPI 2015 Ranking, poverty, Poverty and TPLF tyranny in Ethiopia
1 comment so far

You will see in the news, and officials of the oppressive Ethiopian government will smile convincingly when they tell you, that Ethiopia is thriving with a “double-digit” economic growth.Yet many experts and scholars will explain to you why this is triple-digit nonsense and quadruple-digit propaganda.
Read more from the original source: Double-digit propaganda, Ethiopia’s top 10 wealthiest people, and Ethiopia’s 87 million poor
The Top 10 Poorest Countries in Africa: With one of the lowest GDP Per Capita ($505) on the continent, Ethiopia making the 9th poorest country. September 26, 2016
Posted by OromianEconomist in Uncategorized.Tags: Africa, catatrphic famine, Ethiopia, Ethiopia and poverty, Famine and the “Ethiopia rising” meme, Multidimensional Poverty Index: Ethiopia has the second highest percentage of people who are MPI poor in the world: op Ten Poorest Countries in The World (All in #Africa) – MPI 2015 Ranking, The extents and dimensions of poverty in Ethiopia, The Top 10 Poorest Countries in Africa
add a comment


The Federal Democratic Republic of Ethiopia, commonly known as Ethiopia, is the continent’s ninth poorest country. Its 100 million citizens make it the most populous landlocked nation in the world, and the second most populous on the continent after Nigeria.
Surprisingly, the economic situation in Ethiopia only worsened as recent as 2008, when the country’s inflation rose to double digits due to it’s a myriad of factors including its loose monetary policy, high food prices, and a huge civil service wage bill. Thus, the economic problems in the country are considered structural issues in governance, which are gradually being addressed by the government. The country’s best performing sector is agriculture.
Nevertheless, the country’s GDP remains to be one of the lowest on the continent, making it the 9th poorest nation.
The ten poorests countries are:
10. Guinea-Conakry
9. Ethiopia
8. The Gambia
7. The Democratic Republic of Congo (DRC)
6. Madagascar-
5. Liberia
4. Niger
3. Central African Republic (CAR)
2. Burundi
1. Malawi
9. Ethiopia- GDP per capita: $505.00.
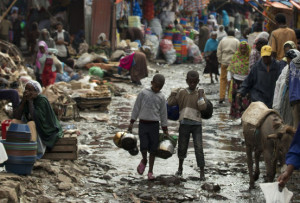
Shoppers and vendors make their way down a flooded street in Merkato, one of Africa’s largest market areas, in Addis Ababa, Ethiopia Wednesday, Aug. 29, 2012. (AP Photo/Rebecca Blackwell)
Tyranny of Experts, illustrated August 17, 2016
Posted by OromianEconomist in Development & Change, Economics, Economics: Development Theory and Policy applications, Ethiopia's Colonizing Structure and the Development Problems of People of Oromia, Free development vs authoritarian model, Uncategorized.Tags: Africa, Free development vs authoritarian model, Multidimensional Poverty Index: Ethiopia has the second highest percentage of people who are MPI poor in the world: op Ten Poorest Countries in The World (All in #Africa) – MPI 2015 Ranking, The Tyranny of Experts, Tyranny and poverty
add a comment
Oxfam: Africa: Ethiopia: The 2016 Multidimensional Poverty Index June 4, 2016
Posted by OromianEconomist in Uncategorized.Tags: Africa, Ethiopia: The 2016 Multidimensional Poverty Index, Incidence of Poverty in Oromia and Ethiopia, Multidimensional Poverty Index, Multidimensional Poverty Index: Ethiopia has the second highest percentage of people who are MPI poor in the world: op Ten Poorest Countries in The World (All in #Africa) – MPI 2015 Ranking, poverty
add a comment

In terms of MPI measurement, Ethiopia’s 87.3% of the population are identified as MPI poor, by far higher than Africa’s average (54%) and East Africa’s average (70%).
MPI Country Briefing 2016, Ethiopia
The 2016 Multi-Dimensional Poverty Index was published on 3rd June 2016. It now covers 102 countries in total, including 75 per cent of the world’s population, or 5.2 billion people. Of this proportion, 30 per cent of people (1.6 billion) are identified as multidimensionally poor.
The Global MPI has 3 dimensions and 10 indicators (for details see here and the graphic, right). A person is identified as multidimensionally poor (or ‘MPI poor’) if they are deprived in at least one third of the dimensions. The MPI is calculated by multiplying the incidence of poverty (the percentage of people identified as MPI poor) by the average intensity of poverty across the poor. So it reflects both the share of people in poverty and the degree to which they are deprived.

The MPI increasingly digs down below national level, giving separate results for 962 sub-national regions, which range from having 0% to 100% of people poor (see African map, below). It is also disaggregated by rural-urban areas for nearly all countries as well as by age.
Headlines from the MPI 2016:
- There are 50% more MPI poor people in the countries analysed than there are income poor people using the $1.90/day poverty line.
- Almost one third of MPI poor people live in Sub-Saharan Africa (32.%); 53% in South Asia, and 9% in East Asia.
- As with income poverty, three quarters of MPI poor people live in Middle Income Countries.
This year’s MPI focuses on Africa:
- In the 46 African countries analysed, 544 million people (54% of total population) endure multidimensional poverty, compared to 388 million poor people according to the $1.90/day measures.
- The differences between the proportion of $1.90 and MPI poor people are greatest in East and West Africa. By the $1.90/day poverty line, 48% in West Africa and 33% in East Africa are poor, whereas by the MPI, 70% of people in East Africa are MPI poor and 59% in West Africa. The MPI thus reveals a hidden face of poverty that may be overlooked if we consider only its income aspects.

- Among 35 African countries where changes to poverty over time were analysed, 30 of them have reduced poverty significantly. Rwanda was the standout star, but every MPI indicator was significantly reduced in Burkina Faso, Comoros, Gabon and Mozambique as well.
- Disaggregated MPI results are available for 475 sub-national regions in 41 African countries. The poorest region continues to be Salamat in Chad, followed by Est in Burkina Faso and Hadjer Iamis in Chad. The region with the highest percentage of MPI poor people is Warap, in South Sudan, where 99% of its inhabitants are considered multidimensionally poor. The least poor sub-national regions include Grand Casablanca in Morocco and New Valley in Egypt, with less than 1% of the population living in multidimensional poverty.
- The MPI registered impressive reductions in some unexpected places. 19 sub-national regions – regional ‘runaway’ successes – have reduced poverty even faster than Rwanda. The fastest MPI reduction was found in Likouala in the Republic of the Congo.
- The Sahel and Sudanian Savanna Belt contains most of the world’s poorest sub-regions, showing the interaction between poverty and harsh environmental conditions.
- Poverty looks very different in different parts of the continent. While in East Africa deprivations related to living standards contribute most to poverty, in West Africa child mortality and education are the biggest problems.
- The deprivations affecting the highest share of MPI poor people in Africa are cooking fuel, electricity and sanitation.
- The number of poor people went down in only 12 countries. In 18 countries, although the incidence of MPI fell, population growth led to an overall rise in the number of poor people.
See here for my post on the MPI 2014. I’d be interested in your reflections on what MPI adds to the usual $ per day metrics, in terms of our understanding of development.
http://www.dataforall.org/dashboard/ophi/index.php/mpi/country_briefings
UNDP: Multidimensional Poverty Index: Ethiopia has the second highest percentage of people who are MPI poor in the world: of Ten Poorest Countries in The World (All in #Africa) – MPI 2015 Ranking April 10, 2016
Posted by OromianEconomist in Africa, Africa Rising, African Poor, Economics: Development Theory and Policy applications, Ethiopia the least competitive in the Global Competitiveness Index, Ethiopia's Colonizing Structure and the Development Problems of People of Oromia, Afar, Ogaden, Sidama, Southern Ethiopia and the Omo Valley, Free development vs authoritarian model, Growth and Inequqlity, Poverty, The extents and dimensions of poverty in Ethiopia, Uncategorized.Tags: Africa, Ethiopia, Ethiopia and poverty, Human Development Index for Oromia and Ethiopia, Multidimensional Poverty Index: Ethiopia has the second highest percentage of people who are MPI poor in the world: op Ten Poorest Countries in The World (All in #Africa) – MPI 2015 Ranking, poverty, Poverty and Famines: An Essay on Entitlement and Deprivation, UNDP
1 comment so far
Multidimensional Poverty Index: Ethiopia has the second highest percentage of people who are MPI poor in the world: of Ten Poorest Countries in The World (All in #Africa) – MPI 2015 Ranking


‘Human development is a process of enlarging people’s choices—as they acquire more capabilities and enjoy more opportunities to use those capabilities. But human development is also the objective, so it is both a process and an outcome. Human development implies that people must influence the process that shapes their lives. In all this, economic growth is an important means to human development, but not the goal. Human development is development of the people through building human capabilities, for the people by improving their lives and by the people through active participation in the processes that shape their lives. It is broader than other approaches, such as the human resource approach, the basic needs approach and the human welfare approach.’ -UNDP 2015 Report
Ethiopia’s HDI value for 2014 is 0.442— which put the country in the low human development category— positioning it at 174 out of 188 countries and territories.
In Ethiopia 88.2 percent of the population (78,887 thousand people) are multidimensionally poor while an additional 6.7 percent live near multidimensional poverty (6,016 thousand people). The breadth of deprivation (intensity) in Ethiopia, which is the average of deprivation scores experienced by people in multidimensional poverty, is 60.9 percent. The MPI, which is the share of the population that is multidimensionally poor, adjusted by the intensity of the deprivations, is 0.537. Rwanda and Uganda have MPIs of 0.352 and 0.359 respectively. Ethiopia, UNDP country notes
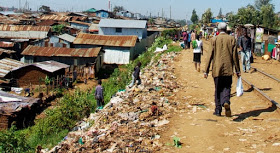
(Sunday Adelaja’s Blog) — When Poverty and non-existent double digit growth met face-to-Face at a dumpster site called KORA in Ethiopia. As we speak, thousands of people in Addis Ababa survive from the leftover “food” dumped in such dumpsters. People, in fact, used to call them “Dumpster Dieters”. They are either the byproducts or victims of the cooked economic figures. You be the judge!
Yet the new measurement known as the Multidimensional Poverty Index, or MPI, that will replace the Human Poverty index in the United Nations’ annual Human Development Report says that Ethiopia has the second highest percentage of people who are MPI poor in the world, with only the west African nation of Niger fairing worse. You probably heard that Ethiopia has been a fast growing economy in the content recording very high growth rate not just in Africa but the world as well.
This comes as more international analysts have also began to question the accuracy of the Meles government’s double digit economic growth claims and similar disputed government statistics referred by institutions like the IMF. The list starts with the poorest.
- Niger
- Ethiopia
- Mali
- Burkina Faso
- Burundi
- Somalia
- Central African Republic
- Liberia
- Guinea
- Sierra Leone
What is the MPI?
People living in poverty are affected by more than just income. The Multidimensional Poverty Index (MPI) complements a traditional focus on income to reflect the deprivations that a poor person faces all at once with respect to education, health and living standard. It assesses poverty at the individual level, with poor persons being those who are multiply deprived, and the extent of their poverty being measured by therange of their deprivations.
Why is the MPI useful?
According to the UNDP report, the MPI is a high resolution lens on poverty – it shows the nature of poverty better than income alone. Knowing not just who is poor but how they are poor is essential for effective humandevelopment programs and policies. This straightforward yet rigorous index allows governments and other policymakers to understand the various sources of poverty for a region, population group, or nation and target their humandevelopment plans accordingly. The index can also be used to show shifts in the composition of poverty over time so that progress, or the lack of it, can be monitored.
The MPI goes beyond previous international measures of poverty to:
-
Show all the deprivations that impact someone’s life at the same time – so it can inform a holistic response.
-
Identify the poorest people. Such information is vital to target people living in poverty so they benefit from key interventions.
-
Show which deprivations are most common in different regions and among different groups, so that resources can be allocated and policies designed to address their particular needs.
-
Reflect the results of effective policy interventions quickly. Because the MPI measures outcomes directly, it will immediately reflect changes such as school enrolment, whereas it can take time for this to affect income.

You must be logged in to post a comment.