Posted by OromianEconomist in Uncategorized.
Tags: Africa, Ethiopia: The 2016 Multidimensional Poverty Index, Incidence of Poverty in Oromia and Ethiopia, Multidimensional Poverty Index, Multidimensional Poverty Index: Ethiopia has the second highest percentage of people who are MPI poor in the world: op Ten Poorest Countries in The World (All in #Africa) – MPI 2015 Ranking, poverty

In terms of MPI measurement, Ethiopia’s 87.3% of the population are identified as MPI poor, by far higher than Africa’s average (54%) and East Africa’s average (70%).
MPI Country Briefing 2016, Ethiopia
Global-MPI-2016-2-pager
The 2016 Multi-Dimensional Poverty Index was published on 3rd June 2016. It now covers 102 countries in total, including 75 per cent of the world’s population, or 5.2 billion people. Of this proportion, 30 per cent of people (1.6 billion) are identified as multidimensionally poor.
The Global MPI has 3 dimensions and 10 indicators (for details see here and the graphic, right). A person is identified as multidimensionally poor (or ‘MPI poor’) if they are deprived in at least one third of the dimensions. The MPI is calculated by multiplying the incidence of poverty (the percentage of people identified as MPI poor) by the average intensity of poverty across the poor. So it reflects both the share of people in poverty and the degree to which they are deprived.

The MPI increasingly digs down below national level, giving separate results for 962 sub-national regions, which range from having 0% to 100% of people poor (see African map, below). It is also disaggregated by rural-urban areas for nearly all countries as well as by age.
Headlines from the MPI 2016:
- There are 50% more MPI poor people in the countries analysed than there are income poor people using the $1.90/day poverty line.
- Almost one third of MPI poor people live in Sub-Saharan Africa (32.%); 53% in South Asia, and 9% in East Asia.
- As with income poverty, three quarters of MPI poor people live in Middle Income Countries.
This year’s MPI focuses on Africa:
- In the 46 African countries analysed, 544 million people (54% of total population) endure multidimensional poverty, compared to 388 million poor people according to the $1.90/day measures.
- The differences between the proportion of $1.90 and MPI poor people are greatest in East and West Africa. By the $1.90/day poverty line, 48% in West Africa and 33% in East Africa are poor, whereas by the MPI, 70% of people in East Africa are MPI poor and 59% in West Africa. The MPI thus reveals a hidden face of poverty that may be overlooked if we consider only its income aspects.

- Among 35 African countries where changes to poverty over time were analysed, 30 of them have reduced poverty significantly. Rwanda was the standout star, but every MPI indicator was significantly reduced in Burkina Faso, Comoros, Gabon and Mozambique as well.
- Disaggregated MPI results are available for 475 sub-national regions in 41 African countries. The poorest region continues to be Salamat in Chad, followed by Est in Burkina Faso and Hadjer Iamis in Chad. The region with the highest percentage of MPI poor people is Warap, in South Sudan, where 99% of its inhabitants are considered multidimensionally poor. The least poor sub-national regions include Grand Casablanca in Morocco and New Valley in Egypt, with less than 1% of the population living in multidimensional poverty.
- The MPI registered impressive reductions in some unexpected places. 19 sub-national regions – regional ‘runaway’ successes – have reduced poverty even faster than Rwanda. The fastest MPI reduction was found in Likouala in the Republic of the Congo.
- The Sahel and Sudanian Savanna Belt contains most of the world’s poorest sub-regions, showing the interaction between poverty and harsh environmental conditions.
- Poverty looks very different in different parts of the continent. While in East Africa deprivations related to living standards contribute most to poverty, in West Africa child mortality and education are the biggest problems.
- The deprivations affecting the highest share of MPI poor people in Africa are cooking fuel, electricity and sanitation.
- The number of poor people went down in only 12 countries. In 18 countries, although the incidence of MPI fell, population growth led to an overall rise in the number of poor people.
See here for my post on the MPI 2014. I’d be interested in your reflections on what MPI adds to the usual $ per day metrics, in terms of our understanding of development.
http://oxfamblogs.org/fp2p/the-2016-multidimensional-poverty-index-was-launched-yesterday-what-does-it-say/
http://www.dataforall.org/dashboard/ophi/index.php/mpi/country_briefings
Posted by OromianEconomist in Africa, African Poor, Colonizing Structure, Corruption in Africa, Free development vs authoritarian model, Poverty.
Tags: a continent of poverty, Africa, Africa: a continent of wealth, African Studies, Developing country, Illicit Financial Flows from Ethiopia, Incidence of Poverty in Oromia and Ethiopia, Poverty and Famines: An Essay on Entitlement and Deprivation


Africa: a continent of wealth, a continent of poverty
By Tom Lebert, senior international programme officer (Resources & Conflict) at War on Want.
At New Internationalist Blog
There has been much talk of an African renaissance in recent years. Thabo Mbeki, South Africa’s second post-apartheid president, has spoken of a ‘rebirth that must encompass all Africans’. So as African politicians and mining companies convene in London this week for ‘Mining on Top’ – Africa’s annual mining summit – where are the voices of civil society? Their absence speaks volumes.
Africa is blessed with a rich bounty of natural resources. The continent holds around 30% of the world’s known mineral reserves. These include cobalt, uranium, diamonds and gold, as well as significant oil and gas reserves. Given this natural wealth it comes as no surprise that, with the tripling of global mineral and oil prices in the past decade, mining has exploded on the African continent. Over the period 2000 to 2008 resource extraction contributed more than 30% of Africa’s GDP while the annual flow of foreign direct investment into Africa increased from $9 billion to $62 billion (most of this into extractive industries). However, despite being so richly endowed, and despite the mining boom of the past decade, Africa has drawn little benefit from this mineral wealth and remains one of the poorest continents on the globe, with almost 50% of the population living on less than $1.25 per day.
So, why is it that a continent with such vast potential wealth can remain so poor? It is in large part down to ‘illicit financial flows’: the illegal movement of money or capital from one country to another. The exploitation of mineral resources has all too often led to corruption and a large proportion of the continent’s resources and revenues benefiting local and foreign elites rather than the general population. Trade mispricing (and in particular transfer pricing and trade misinvoicing) is the most common way of transferring illicit funds abroad. Through trade mispricing, companies seek to maximize profits artificially through maximizing expenses in high-tax jurisdictions and maximizing revenue and income in low-tax jurisdictions. This enables corporations to minimize tax payments illegally and transfer the funds abroad.
Such illicit flows undermine social development and stymy inclusive economic growth. Instead of investing resource revenues into improving infrastructure, health and education, political elites, often in collusion with mining companies, have siphoned off proceeds from the continent’s mineral and oil wealth – lining their own pockets to the detriment of ordinary Africans.
Zambia presents as a wealthy country – the largest producer of copper in Africa and the 7th-largest globally. Yet Zambia is one of the poorest countries in the world, with 74% of the population living on less than $1.25 a day and 43% of the population being undernourished. This is in part due to a haemorrhaging of wealth, mainly to transnational mining companies. According to the Zambian Deputy Finance Minister, in 2012 the country was losing $2 billion a year from tax avoidance – around 10% of Zambia’s GDP. The mining industry was the largest culprit and the bulk of the loss was attributed to transfer pricing – where parts of the same company trade with each other at prices that they determine on their own – and to the over-reporting of costs and under-reporting of production. The situation is compounded by overly generous tax incentives provided to companies by the Zambian government.
The Zambian example is not an isolated case. Such corporate practices in the mining sector are common right across the continent. In South Africa, illegal capital flight through trade-misinvoicing (a means to evade tax) is rife in the ores and metals sector. Over the period 1995 to 2006 trade misinvoicing alone amounted to $167 million. And when it comes to fuel-exporting countries, over the period 1970 to 2008 states were losing on average $10 billion per year because of misinvoicing – the sum accounting for nearly half of all illicit financial flows from Africa during this time. Moreover, statistical data generated through the Kimberly Process Certification Scheme, which was introduced in 2003, revealed that diamond production was nearly twice as large as estimated, indicating massive smuggling, under-reporting and tax evasion in the sector. The list goes on.
So, what is to be done? At the heart of any solution must be transparency. Countries need to be more open in their dealings with mining companies, put in place and enforce fairer tax regimes and anti-corruption rules, and pursue economic policies that promote diversified economies and reduce dependence on revenues from mineral wealth. International mining capital would also, of course, have to play by the rules or be held to account for its indiscretions. Such measures would go some way to ensuring that the continent’s wealth benefits ordinary people and puts Africa onto a path to greater prosperity.
Mining routinely disrupts and destroys people’s livelihoods while damaging their health and the environment. It is local communities right across the continent that are most affected by the extractives industry. ‘Mining on Top’ should be the perfect opportunity to bring these communities into the very discussions that will affect their lives. Shamefully, they’ve not been invited. So while the mining elite discuss how best to exploit a continent, ordinary Africans continue to lose out.
The ‘Mining on Top’ Africa – London Summit takes place on 24-26 June at the Park Plaza Riverbank Hotel, 200 Westminster Bridge, SE1 7UT. On Thursday 25 June, War on Want will join London Mining Network and Gaia Foundation in protest at the failure of organizers to include civil-society representatives at the summit.
http://newint.org/blog/2015/06/24/africa-a-continent-of-wealth/
Posted by OromianEconomist in Africa, African Poor, Amnesty International's Report: Because I Am Oromo, Ethiopia's Colonizing Structure and the Development Problems of People of Oromia, Free development vs authoritarian model, Poverty, Schools in Oromia, The State of Food Insecurity in Ethiopia.
Tags: Africa, Africa Rising, African Studies, Animal Farm and The Ethiopian Empire System, Applied economics, Causes of poverty, Corruption, Dead Aid, Genocide against the Oromo, Human Development Index for Oromia and Ethiopia, Incidence of Poverty in Oromia and Ethiopia, Land grabs in Africa, Land Grabs in Oromia, poverty, The Tyranny of Ethiopia

“All animals are equal, but some animals are more equal than others.”
-George Orwell, Animal Farm
“The very common way that the EPRDF and its agents try to shift the public attention from lack of human and democratic rights and the daylight looting of the country’s resources, is by referring to the ‘impressive’ economic development registered in their rule. If they are talking about the only region that they are exclusively devoted to developing, then, they are absolutely right.”
https://oromianeconomist.wordpress.com/2015/04/07/opinion-why-ethiopias-growth-rhetoric-is-faulty-africa/
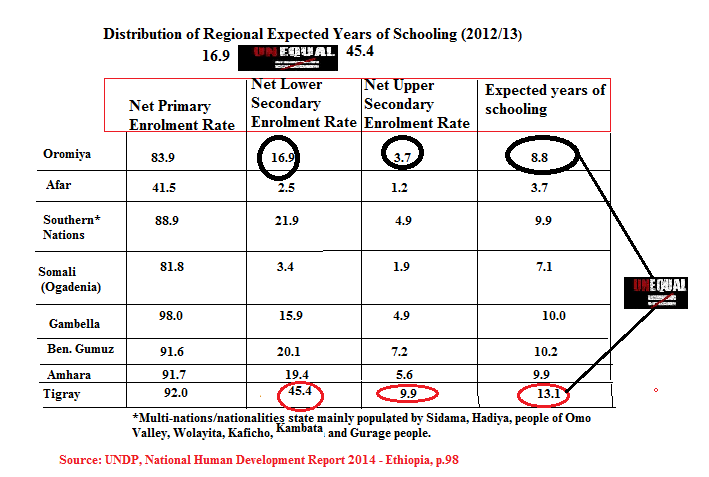
In TPLF /Tigray dominated minority tyrannic regime of Orwellian social and development policy, all nations and nationalities in theory are equal in Ethiopia, but in reality Tigray is more equal than others. This is not a development process.
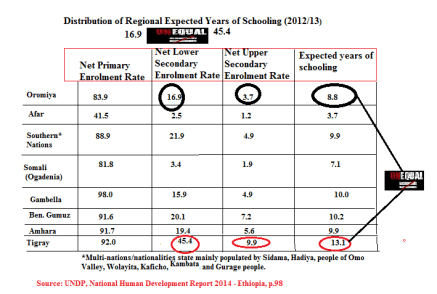
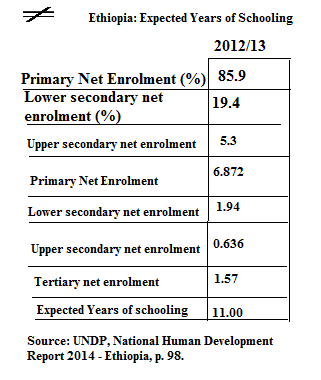
According to UNDP report, while more than 45% of children in Tigray have achieved Net Lower Secondary Enrollment, the statistics for Oromia is only 16.9%, very huge inequality variations. The report indicated that while Human development Index (HDI) of Tigray is the highest (above national average), states such as Oromia, Afar, Ogaden and Amhara have the lowest HDIs, below the national HDI of 0.461. These are the outcomes of Tigray only, exclusionist, social, economic and development policies of the ruling regime. UNDP is not exposing the Tigray only growth and development strategy but we can read from its data and graphs.

As the TPLF has been engaged (https://oromiaeconomist.wordpress.com/2014/10/30/amnesty-internationals-report-because-i-am-oromo-a-sweeping-repression-in-oromia/) in destabilizing, robbing and massive evictions of people from their ancestral home and land grabs in Oromia, by all sorts of engagement, resource and soil transfers, it has conducting massive subsidized development in its Tigray home. In other studies, BBC Magazine in its 20th April 2015 publication under the title ‘ Turning Ethiopia’s desert green,’reports: ” A generation ago Ethiopia’s Tigray province was stricken by a famine that shocked the world. Today, as Chris Haslam reports, local people are using ancient techniques to turn part of the desert green. In the pink-streaked twilight, a river of humanity is flowing across Tigray’s dusty Hawzien plain. This cracked and desiccated landscape, in Ethiopia’s far north, occupies a dark corner of the global collective memory. Thirty years ago, not far from here, the BBC’s Michael Buerk first alerted us to a biblical famine he described as “the closest thing to hell on earth”. Then Bob Geldof wrote Do They Know It’s Christmas? – a curious question to ask of perhaps the world’s most devoutly Christian people – and thereafter the name Tigray became synonymous with refugees, Western aid and misery. The Tigrayan people were depicted as exemplars of passive suffering, dependent on the goodwill of the rest of the planet just to get through the day without dying. But here, outside the village of Abr’ha Weatsbaha, I’m seeing a different version. From all directions, streams of people are trickling into that human river.” http://www.bbc.co.uk/news/magazine-32348749.
Martin Plaut’s analysis which is based on world banks report is also interesting and important to refer here which is as follows:-
The World Bank has just published an authoritative study of poverty reduction in Ethiopia. The fall in overall poverty has been dramatic and is to be greatly welcomed. But who has really benefited?
This is the basic finding:
In 2000 Ethiopia had one of the highest poverty rates in the world, with 56% of the population living on less than US$1.25 PPP a day. Ethiopian households experienced a decade of remarkable progress in wellbeing since then and by the start of this decade less than 30% of the population was counted as poor.
There are of course many ways of answering the question – “who benefited” – were they men or women, urban or rural people. All these approaches are valid.
The Ethnic Dimension
But in Ethiopia, where Ethic Federalism has been the primary driver of government policy one cannot ignore the ethnic dimension.
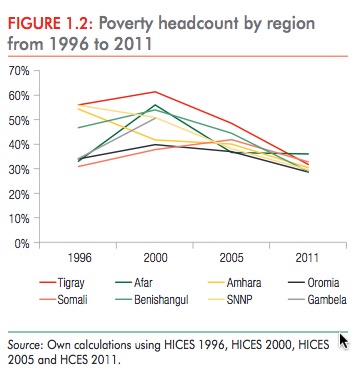
Here this graph is particularly telling:

Tigray first
The answer is clear: it is the people of Tigray, whose party, the TPLF led the fight against the Mengistu regime and took power in 1991, who benefited most. What is also striking is that the Oromo (who are the largest ethnic group) hardly benefited at all.
This is what the World Bank says about this: “Poverty reduction has been faster in those regions in which poverty was higher and as a result the proportion of the population living beneath the national poverty line has converged to around one in 3 in all regions in 2011.”
The World Bank does little to explain just why Tigray has done (relatively) so well, but it does point to the importance of infrastructure investment and the building of roads. It also points to this fact: “Poverty rates increase by 7% with every 10 kilometers from a market town. As outlined above, farmers that are more remote are less likely to use agricultural inputs, and are less likely to see poverty reduction from the gains in agricultural growth that are made. The generally positive impact of improvements in infrastructure and access to basic services such as education complements the evidence for Ethiopia that suggests investing in roads reduces poverty.”
Not surprisingly, the TPLF under Prime Minister Meles Zenawi and beyond concentrated their investment on their home region – Tigray. The results are plain to see. https://martinplaut.wordpress.com/2015/01/23/ethiopias-poverty-reduction-who-benefits/
In its 2014 National Human Development Report, which has been written on the theme of “Accelerating Inclusive Growth for Sustainable Human Development in Ethiopia,” UNDP indicates that 25 million Ethiopians currently remain trapped in poverty and vulnerability. This and many Ethiopians just above the poverty line are vulnerable to shocks and food insecurity. Maternal health care has lagged well behind other health statistics and the availability of effective health care is inconsistent across the country. UNDP’s educational indicators suggest ongoing problems with the quality of education, as shown by retention rates and educational performance markers. UNDP says, perhaps most worrying from the standpoint of inclusive growth are the high rates of un- and underemployment in both urban and rural areas, especially as large numbers of productive jobs for the poor and near-poor are needed under current and projected labour market trends. Economic growth over the past decade has generally meant an increase in productivity and output levels in some parts of the economy, but these have been accompanied by increasing severity of poverty. The absolute number of the poor is roughly the same as 15 years ago and a significant proportion of the population hovers just above the poverty line and is vulnerable to shocks. Moreover, the severity of poverty 2 increased from 2.7 per cent in 1999/2000 to 3.1 per cent in 2010/11 (MoFED, 2013b). The prevalence of vulnerabilities and food insecurity are on the rise.
According to UNDP report, during the last three years (2010/11-2012/13), inflation was in double digits. The inflation rate, which was 18 per cent in 2010/11, increased to 33.7 per cent in 2011/12, declined to 13.5 per cent in 2012/13 and fell further to 8.1 per cent in December 2013. Other studies demonstrate that inflation figures have always been in double digits including 2013 and 2014 and at present.
Further, UNDP says with a Human Development Index (HDI) of 0.435 in 2013, the country is still classified as a “low human development” country, based on UNDP’s Human Development Index. Even though Ethiopia is one of the 10 countries globally that has attained the largest absolute gains in its HDI over the last several years, in the most recent Human Development Report (2014) Ethiopia ranks 173rd out of 187 countries. Thus, its Human Development Index (HDI) has not moved appreciably during the past decade, when compared with other developing countries that have registered similar growth rates. Looking at the HDI values of Seychelles, Tunisia and Algeria, which are in the high HDI bracket, and the other 12 African countries, which are in the medium HDI bracket, the major reasons why Ethiopia is still in the low HDI bracket are low education performance (particularly low mean years of schooling) and low GNI per capita. The minimum mean years of schooling and GNI per capita for medium HDI countries were 3.5 years and US$3,000, respectively in contrast to Ethiopia’s mean years of schooling of 2.6 years and GNI per capita of US$1,300. The inequality-adjusted Human Development index (IHDI), which is basically the HDI discounted for inequalities, is also computed for Ethiopia. Between 2005 and 2013, the IHDI increased from 0.349 to 0.459 indicating an average human development loss of 0.5 per cent per annum due to inequalities in health, access to education and income. According to (UNDP 2014), Ethiopia’s IHDI for 2013 was 0.307 in contrast to HDI of 0.435 indicating an overall human development loss of 29.4 per cent.
With regard to regional disparities in HDI values, while Tigray is significantly above national average, the four states of Afar, Somali, Amhara and Oromia have the lowest HDIs, below the national HDI of 0.461.
The outcome of the development strategy of Tigray only when mathematically averaged to the whole regions cannot hide TPLF’s Apartheid policy on Oromia and the rest as it is only the development focus for 5% of the 94 million population. Thus, Tigray is rich but Ethiopia is poor. Ethiopia is rich and fast growing only for development tourists those who lodge in Finfinne and tour to Tigray to take a sample and conclude the result for the whole states.
With regard to regional disparities in HDI values, while Tigray is significantly above national average, the four states of Afar, Somali, Amhara and Oromia have the lowest HDIs, below the national HDI of 0.461.
Another social indicator which demonstrates that Tigray is more equal than others is health services. UNDP’s report confirms that there are wide inequalities in the immunization status of children in Ethiopia. Children of educated women, rich households, and Finfinnee (Addis Ababa) and Tigray State have higher chances of being fully immunized. Children from the richest and middle income households are less likely to have no immunization at all (by 74 per cent and 57 per cent respectively) compared with those from the poorest households. Children from SNNPR, Oromiya and Amhara are 3.82, 7.00 and 3.65 times less likely to be fully immunized compared with those from Tigray, which has the second highest proportion of fully immunized children. According to UNDP, a report by Save the Children (2014) also raises concerns about equity in health services citing how immunization coverage is different among different income groups, and between urban and rural areas. According to the report, children from richest households are twice as likely to be immunized compared to those from the poorest households and children in urban areas are twice as likely to be immunized as those in rural areas. Based on revised data from the National Water Sanitation and Health Inventory, national potable water supply coverage increased from 58 per cent to 68.4 per cent between 2009/10 and 2012/13, reflecting an increase in both rural and urban coverage. Even though many health outcomes have improved significantly over the last decade, Ethiopia is still lagging behind on some measures. For example, Ethiopia has still higher than expected shares of malnutrition compared with countries at the same income level. What is especially striking about Ethiopia’s health data is the exceptionally high level of maternal mortality, given Ethiopia’s income level.
UNDP argues that that development can be inclusive and reduce poverty only if all people contribute to creating opportunities, share the benefits of development and participate in decision making.
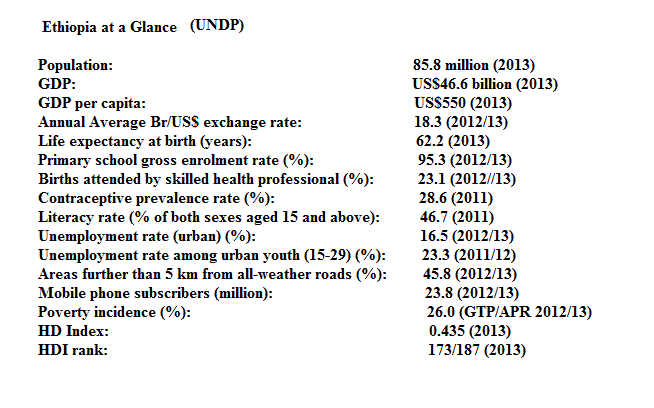
Ethiopia at a Glance (UNDP Report Data)
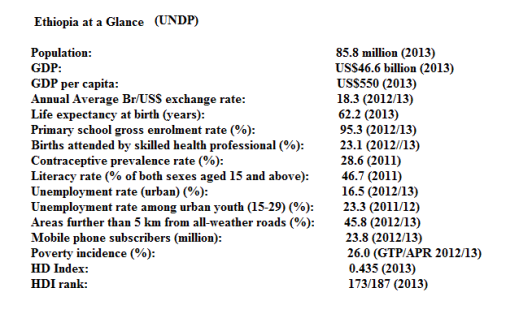
Population: 85.8 million (2013)
GDP: US$46.6 billion (2013)
GDP per capita: US$550 (2013)
Annual Average Br/US$ exchange rate: 18.3 (2012/13)
Life expectancy at birth (years): 62.2 (2013)
Primary school gross enrolment rate (%): 95.3 (2012/13)
Births attended by skilled health professional (%): 23.1 (2012//13)
Contraceptive prevalence rate (%): 28.6 (2011)
Literacy rate (% of both sexes aged 15 and above): 46.7 (2011)
Unemployment rate (urban) (%): 16.5 (2012/13)
Unemployment rate among urban youth (15-29) (%): 23.3 (2011/12)
Areas further than 5 km from all-weather roads (%): 45.8 (2012/13)
Mobile phone subscribers (million): 23.8 (2012/13)
Poverty incidence (%): 26.0 (GTP/APR 2012/13)
HD Index: 0.435 (2013) HDI rank: 173/187 (2013)
Click to access nhdr2015-ethiopia-en.pdf


You must be logged in to post a comment.